Chapter 7: Structural Analysis Within Industries
Study Guide by James R. Martin, Ph.D., CMA
Professor Emeritus, University of South Florida
Porter's Competitive Strategy Main Page
Chapter 7: Structural Analysis Within Industries p. 126
The purpose of this chapter is to extend the concepts of the three generic competitive strategies and structural analysis to explain the differences in firm performance within the same industry. Structural analysis within industries provides an additional analytical tool for developing competitive strategy.
Dimensions of Competitive Strategy p. 127
There are many different dimensions of a firm's competitive strategy within an industry including the following:
Specialization (e.g., the firm has a limited line, or targets customer segments),
Brand identification (e.g., the firm builds its brand through advertising, sales force, etc.),
Push vs. pull (e.g., the firm develops its brand with the ultimate consumer vs. a distribution channel),
Channel selection (e.g., the firm uses specialty outlets, broad line outlets),
Product quality (e.g., the firm emphasizes low tolerances, special features),
Technological leadership (i.e., the firm does not imitate other competitor products),
Vertical integration (e.g., the firm integrates forwards or backwards),
Cost position (e.g., the firm seeks to be the low cost manufacturer and or distributor),
Service (e.g., the firm provides engineering assistance or other ancillary services to customers),
Price policy,
Leverage (e.g., the firm has financial and or operating leverage),
Relationship with parent company (e.g., the firm is a unit of a diversified conglomerate, part of a vertical chain, etc.),
Relationship to home or host government in foreign countries (e.g., the firms gets assistance from the government, or is subject to various regulations).
Strategy Groups p. 129
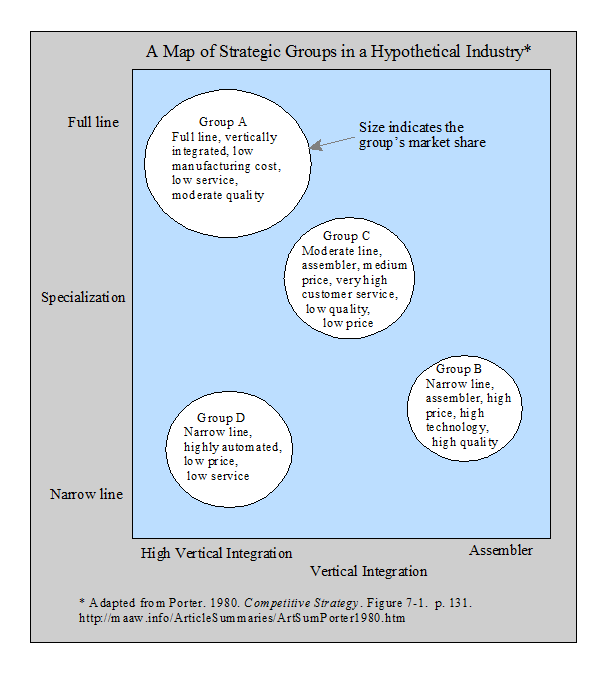
The starting point for a structural analysis within an industry is to characterize the strategies of all the significant competitors based on the dimensions outlined in the section above. The possibilities range from an industry with one strategic group to an industry with multiple groups. However, there are usually a small number of strategic groups in an industry. Strategic groups are defined broadly on the basis of their strategic position within the industry, and can be mapped using various strategic dimensions. An example of a hypothetical industry appears below using the dimensions of specialization and vertical integration.

Strategic Groups and Mobility Barriers p. 132
Entry barriers (e.g., economies of scale, product differentiation, switching costs etc.) affect different strategic groups in different ways. For example, production economies of scale tend to provide significant protection to firms with large plants and extensive vertical integration (See Group A above), but little protection to a narrow line assembler (See Group B). Entry barriers also make it difficult for firms to shift strategic position from one group to another. For example, economies of scale would make it difficult for a narrow line assembler to move into the full line vertically integrated low cost Group. Porter refers to these barriers within an industry as mobility barriers. Mobility barriers create greater profitability potential for firms in certain industry groups, and help explain the existent of relatively stable market shares in an industry. Thus, the second step in structural analysis within an industry (i.e., after mapping the strategic groups), is to determine the level and composition of the mobility barriers protecting each group.
Mobility Barriers and Group Formation p. 135
Strategic groups form and change for many reasons including: Differences in firm skills and resources, differences in their goals or risk profiles, mobility barriers change, investment decisions of early entrants, and changes in the structure of the industry.
Strategic Groups and Bargaining Power p. 136
The third step in the structural analysis within an industry is to determine the relative bargaining power of the strategic groups in the industry. Strategic groups may have different amounts of bargaining power with suppliers and customers because in some cases their strategies make them more vulnerable to common (mass market) suppliers or buyers, or their strategies require them to deal with different suppliers and buyers with different levels of bargaining power.
Strategic Groups and the Threat of Substitutes p. 137
The fourth step in the structural analysis within an industry is to determine each industry group's level of relative exposure to competition from substitute products. The level of a group's exposure to competition from substitute products may differ for many reasons including the firm's focus on different customers or different parts of the product line, different levels of technological sophistication, different cost positions, and other dimensions of their competitive strategy.
Strategic Groups and Rivalry Among Firms p. 138
The fifth step in the structural analysis of an industry is to determine the pattern of market interdependence among strategic groups in the industry, and each groups vulnerability to warfare with other groups. Factors that determine how strong competition will be among groups include:
1. The market interdependence or extent group customer targets overlap. The more interdependence among groups, the greater the competitive rivalry.
2. Group product differentiation. The less group products are differentiated, the greater the competitive rivalry.
3. The number and relative sizes of the strategic groups. The more numerous and more equal in terms of market share the groups are, the greater the competitive rivalry.
4. The strategic distance (or differences in strategies) among groups. The greater the strategic distance among groups, the more likelihood of competitive conflicts.
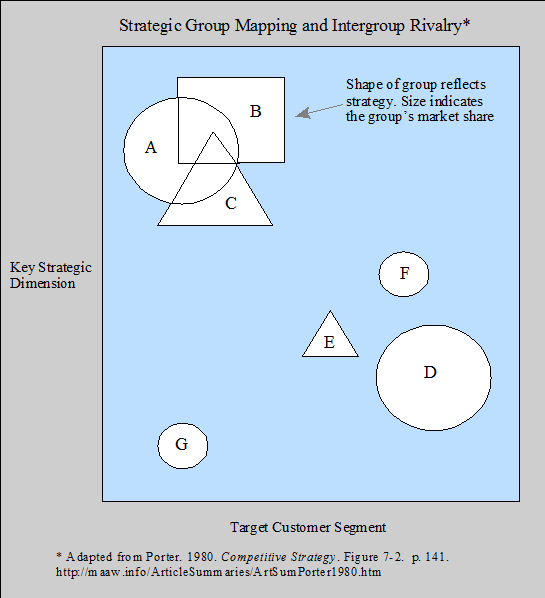
These relationships are illustrated in the adaptation of Porter's Figure 7-2 below. The lettered symbols represent strategic groups where the size of each symbol indicates the group's market share. The shapes of the symbols indicate different strategies, and together show the strategic distance among groups. Overlapping groups compete for the same customer segments. The most volatile situation is where several similar size groups, with different strategies are competing for the same customers, (Groups A, B. and C). The most stable situation is where a few large strategic groups each compete for different customer segments with somewhat similar strategies. Figure 7-2 does not show this situation, but Group D is much less likely to engage in competitive rivalry than Groups A, B, and C, since Group D competes for a different customer segment and interacts more with the smaller specialist groups E and F.

Strategic Groups and a Firm's Profitability p. 142
The determinants of a firm's profitability include:
1. Characteristics that are common to the industry (i.e., rate of industry growth, potential for product differentiation, structure of supplier industries, and technology),
2. Characteristics of the firm's strategic group (i.e., mobility barriers, bargaining power with suppliers and buyers, vulnerability to substitute products, and rivalry from other groups), and
3. The firm's position within its strategic group (i.e., the degree of competition within the group, the scale of the firm, the costs of entry into the group, the firm's ability to implement its strategy).
Industry characteristics affect all firms in the industry, although some competitive strategies provide more profit potential than others. The most favorable strategic group characteristics include situations where there are mobility barriers, strong bargaining power with suppliers and buyers, low vulnerability to substitute products, and low rivalry from other groups.
Favorable characteristics for firms within a strategic group include situations where there is low rivalry within the group, a firm has a large market share, there are significant cost to enter the group, and the firm has ample ability to implement its chosen strategy.
The combination of all of the characteristics mentioned above, together with the many possible competitive strategies (i.e., variations of the three generic strategies) determines the profit potential for a firm.
Are Large Firms More Profitable than Small Firms? p. 145
The relationship between the profitability of large firms versus small firms depends on the industry. For example, in industries where economies of scale are low or absent, or industries that are highly segmented, the rates of return for smaller firms (followers) are greater than those of the larger firms (e.g., clothing, footwear, pottery, meat products).
Strategic Groups and Cost Position p. 148
A low cost position is important, but often causes a firm to sacrifice in other strategic areas such as differentiation, technology, or service. Therefore, to view low cost as always the best strategic position is misleading. Although Porter doesn't mention it here, he provides a classic example in Chapter 2 that makes the point well. In the 1920s Ford had achieved unchallenged cost leadership, but when the market changed to favor automobiles with more styling, comfort and closed rather than open cars, Ford incurred enormous costs of changing its strategy.
Implications for Formulation of Strategy p. 149
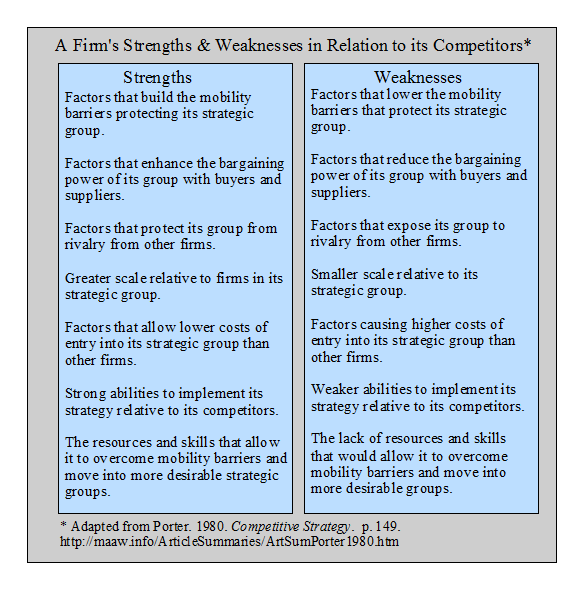
Structural analysis provides a framework for identifying a firm's strengths and weaknesses in relation to its competitors. The following illustration shows two types: Structural and implementational. Structural strengths and weaknesses are related to the characteristics of the industry, e.g., mobility barriers. Implementational strengths and weaknesses are based on the firm's ability to execute strategies, i.e., the abilities of firm's workers and managers.

Based on the concepts illustrated above, a firm has four categories of strategic opportunities including:
Creating a new strategic group,
Shifting to a more favorable strategic group,
Strengthening the structural position of its group or its position within the group, and
Shifting to a new group, and strengthening that group's structural position.
The categories of risks for a firm include:
The risks that other firms will enter its strategic group,
Risks of the reduction of mobility barriers of the firm's strategic group that result in less power with customers or suppliers, or worsening the firm's position in relation to substitute products,
Risks of investments to improve the firm's position by increasing mobility barriers,
Risks of attempting to overcome mobility barriers to a new group or a more desirable group.
The Strategy Group Map as an Analytical Tool p. 152
Developing strategic group maps is a useful tool to help the analyst see the key competitive issues in an industry. The most effective maps are based on the following four principles:
Use strategic variables as axes that determine the key mobility barriers in the industry,
Use axes variables that do not move together, i.e., those that reflect the diversity of strategic combinations in the industry,
The axes on the map need not be continuous, e.g., Porter uses a horizontal axes based on a mix of distribution channels (dealers, mass merchandisers and private label) for a map of the U.S. Chain Saw industry.
An industry can be mapped several times using different strategic dimensions.
After mapping an industry, there are a number of additional steps that can enhance the analysis.
Identify the mobility barriers that protect each group from other groups,
Identify the marginal groups,
Chart the directions in which firm's or group's strategies are moving,
Analyze trends in strategic variables, and
Predict reactions of the industry to events or disturbances.
__________________________________________________
Go to the next Chapter. Porter. 1980. Competitive Strategy. Chapter 8: Industry Evolution. (Summary), or back to Porter's Competitive Strategy Summaries Main Page.
Related summaries:
Christensen, C. M. 1997. Making strategy: Learning by doing. Harvard Business Review (November-December): 141-142, 144, 146, 148, 150-154, 156. (Summary).
Clinton, B. D. and A. H. Graves. 1999. Product value analysis: Strategic analysis over the entire product life cycle. Journal of Cost Management (May/June): 22-29. (Summary).
De Geus, A. 1999. The living company. Harvard Business Review (March-April): 51-59. (Summary).
Fonvielle, W. and L. P. Carr. 2001. Gaining strategic alignment: Making scorecards work. Management Accounting Quarterly (Fall): 4-14. (Summary).
Gosselin, M. 1997. The effect of strategy and organizational structure on the adoption and implementation of activity-based costing. Accounting, Organizations and Society 22(2): 105-122. (Summary).
Iansiti, M. and R. Levien. 2004. Strategy as ecology. Harvard Business Review (March): 68-78. (Summary).
Kaplan, R. S. and D. P. Norton. 1996. Using the balanced scorecard as a strategic management system. Harvard Business Review (January-February): 75-85. (Summary).
Kaplan, R. S. and D. P. Norton. 2000. Having trouble with your strategy? Then map it. Harvard Business Review (September-October): 167-176. (Summary).
Kaplan, R. S. and D. P. Norton. 2001. Transforming the balanced scorecard from performance measurement to strategic management: Part I. Accounting Horizons (March): 87-104. (Summary).
Kaplan, R. S. and D. P. Norton. 2001. Transforming the balanced scorecard from performance measurement to strategic management: Part II. Accounting Horizons (June): 147-160. (Summary).
Kaplan, R. S. and D. P. Norton. 2004. Measuring the strategic readiness of intangible assets. Harvard Business Review (February): 52-63. (Summary).
Kim, W. C. and R. Mauborgne. 1997. Value innovation: The strategic logic of high growth. Harvard Business Review (January-February): 103-112. (Summary).
Kim, W. C. and R. Mauborgne. 1999. Creating new market space: A systematic approach to value innovation can help companies break free from the competitive pack. Harvard Business Review (January-February): 83-93. (Summary).
Kim, W. C. and R. Mauborgne. 2002. Charting your company's future. Harvard Business Review (June): 77-83. (Summary).
Langfield-Smith, K. 1997. Management control systems and strategy: A critical review. Accounting, Organizations and Society 22(2): 207-232. (Summary).
Luehrman, T. A. 1998. Strategy as a portfolio of real options. Harvard Business Review (September-October): 89-99. (Summary).
Malone, D. and M. Mouritsen. 2014. Change management: Risk, transition, and strategy. Cost Management (May/June): 6-13. (Summary).
Martin, J. R. Not dated. What is a learning curve? Management And Accounting Web. LearningCurveSummary.htm
O'Clock, P. and K. Devine. 2003. The role of strategy and culture in the performance evaluation of international strategic business units. Management Accounting Quarterly (Winter): 18-26. (Summary).
O'Reilly, C. A. III. and M. L. Tushman. 2004. The ambidextrous organization. Harvard Business Review (April): 74-81. (Summary).
Porter, M. E. 1996. What is a strategy? Harvard Business Review (November-December): 61-78. (Summary).
Porter, M. E. 2001. Strategy and the internet. Harvard Business Review (March): 63-78. (Summary).
Reeves, M., C. Love and P. Tillmanns. 2012. Your strategy needs a strategy. Harvard Business Review (September): 76-83. (Note).
Simons, R. 1995. Control in an age of empowerment. Harvard Business Review (March-April): 80-88. (Summary).