Chapter 6
The Traditional Two Stage Cost Allocation Approach
James R. Martin, Ph.D., CMA
Professor Emeritus, University of South Florida
MAAW's Textbook Table of Contents
After you have read and studied this chapter, you should be able to:
1. Discuss the various purposes of cost allocations.
2. Discuss the different conceptual bases for allocating costs to cost objects.
3. Describe three general methods of assigning costs to products including one stage and two stage approaches.
4. Discuss the circumstances under which each of the methods referred to in learning objective 3 will provide accurate product costs.
5. Describe the direct, step-down and reciprocal methods of allocating service department costs to producing departments.
6. Solve stage I cost allocation problems using the three methods referred to in the previous learning objective.
7. Compare dual rate and single rate methods for stage I cost allocations.
8. Solve cost allocations problems using the dual rate and single rate methods.
9. Discuss the cost distortions that tend to occur when a plant wide overhead rate is used.
10. Solve cost allocation problems using plant wide and departmental overhead rates.
Learning objectives for Appendix 6-1
11. Provide conceptual definitions for joint products, by-products and joint costs.
12. Describe five methods of treating joint costs in the accounting records.
13. Solve problems involving the methods referred to in learning objective 12.
14. Describe and use one typical method of accounting for by-products.
Cost allocation is an important topic because many of the costs associated with designing, producing and distributing products and services are not easily identified with the products and services that are created. Although an introduction to overhead cost allocations is provided in Chapter 4, the overall topic is much broader than using a predetermined overhead rate. The purpose of this chapter is to extend the Chapter 4 discussion to include the concepts underlying cost allocations as well as a variety of methods for assigning costs to the various products and services produced. The chapter provides some previously omitted conceptual and technical material to help us move from the abbreviated cost systems discussed in Chapters 4 and 5 closer to the point where we can visualize an operational cost accounting system.
More specifically, the chapter includes four main sections. The first section provides a discussion of
the conceptual foundation for cost allocations including the purposes and underlying logic associated with the various methods. Section two is the longest
section and includes several subsections related to service department costs. The first subsection provides a brief discussion of three general approaches for
assigning service department costs to products. These methods include using a plant wide rate, departmental rates and activity based rates. This section also
includes a discussion of the circumstances that are necessary for each of these methods to provide accurate product costs. The following subsection extends the
discussion of departmental overhead rates to include the allocations from service departments to producing departments. This part includes three methods
for accomplishing these first stage allocations in what many refer to as the traditional two stage approach. In addition, a technique referred to as the dual
rate or flexible budget method is presented to show how fixed and variable service department costs can be allocated separately. This section compares dual
rate and single rate methods and illustrates how spending and idle capacity variances can be calculated for service departments. Section three compares a
plant wide overhead rate with departmental rates and shows how product costs tend to be distorted when a plant wide rate is used. The last section is
included in an appendix and introduces two special categories of products referred to as joint products and by-products. This section addresses the issues
associated with assigning costs to these products and includes a variety of methods
CONCEPTS UNDERLYING COST ALLOCATIONS
The underlying concepts of cost allocations relate to the purposes of assigning costs to cost objects as well as the principles, or supporting logic for the cost allocation methods chosen.
PURPOSES OF COST ALLOCATIONS
The purposes of cost allocations are closely related to the purposes of information systems outlined in Chapter 2 (See Exhibit 2-4 for a review). Cost allocations are needed to value inventory for external reporting purposes, for planning and monitoring the cost of activities and processes, and for various short term and long term strategic decisions. Some examples include decisions to "make or buy" sub-components and services, how to price products and services, when to add or discontinue various products and services and when to expand or contract the size of a segment of the company. Cost allocations are also needed to support a price when "cost-plus" pricing is used, as in government contracting, and in situations where costs must be justified before reimbursement can be obtained, as in Medicare reimbursements to medical facilities. In addition, since cost allocation methods are components of the overall performance evaluation system, cost allocations tend to influence the behavior of the participants within the system. Therefore, system designers must also carefully consider the motivational, or behavioral aspects of alternative cost allocation methods.
THE SUPPORTING LOGIC OF COST ALLOCATION METHODS
From the perspective of the matching concept, (i.e., matching cost and benefits) it is logical to allocate a cost to the object (e.g., user, activity, department, product) based on a "cause and effect" relationship. The idea is to allocate the cost to whatever causes, or drives the cost. If the driver for a cost cannot be identified, or identified easily, then an allocation scheme perceived to be "fair and equitable" might be used. A search for a "fair and equitable" allocation method often leads the system designer to the "ability to bear" the cost logic. Some examples that most readers can relate to include allocating the costs of federal, state and local governments to their constituents. Federal and state income taxes are based on the "ability to bear" logic, i.e., they are progressive in that those with higher incomes pay a higher percentage of their incomes than those with lower incomes. On the other hand, gasoline taxes are based on the "benefits received" logic because these taxes are used to maintain the highway infrastructure (e.g., roads, bridges, lighting, traffic signs, signals and highway patrols) for those who use the highways. Whether either of these tax allocation schemes is also "fair and equitable" is subjective and therefore controversial. For example, those who pay little or no income taxes tend to receive the greatest benefits in the form of welfare and other government transfer payments. Some observers say this is fair, while others voice the opposite viewpoint. Gasoline taxes, on the other hand, are regressive in that those with lower incomes pay a larger percentage of their incomes than those with higher incomes for an equal quantity of gasoline. Using the "ability to bear", or percentage of income perspective, gasoline taxes appear to be unfair to low income drivers. However, using the "benefits received" perspective, gasoline taxes appear to be fair.
Although issues concerning the equitableness of various types of taxes are outside the scope of a cost accounting course, similar controversial issues arise with regard to cost allocations within organizations. Generally, the allocation method should reflect the purpose of the allocation. For example, for the purposes related to product costing, (e.g., external reporting, planning and monitoring, pricing) costs are typically allocated (or traced) to products based on the "cause and effect" logic. Using the methods described in Chapter 3 (e.g., regression and correlation analysis) the system designer might attempt to define a relationship between the cost and the cost drivers objectively. On the other hand, if an objective measure based on "cause and effect" is difficult or impossible to obtain, or if objectivity seems to conflict with the purpose of the allocation, the system designer might use the "fairness and equity" logic instead. For example, for performance evaluation and motivation purposes, the "fairness and equity" logic is sometimes more appropriate for common administrative and facility related costs. Examples include top management salaries, internal auditing, company legal and medical facilities, advertising designed to promote the company image, public relations and landscaping around the facility. From the "fairness and equity" perspective, one could argue that these costs should not be allocated at all, or if they are allocated to the various segments of a company, the "ability to bear" logic should be used.
One can see from the preceding discussion, that although identifying the purposes and logic supporting cost allocations is helpful in framing the cost allocation questions, it does not necessarily provide the answers, certainly not definitive answers. System designers must remember that cost allocations affect performance evaluations, which in turn affect performance. As indicated in Chapter 1, performance evaluation systems are interactive in that they simultaneously measure and influence the behavior of the participants within the system.
ALLOCATING SERVICE DEPARTMENT COSTS
The various functional areas within a manufacturing facility are usually separated into two types of departments. These include producing departments and service departments. Producing departments convert raw, or direct materials into finished products. Service departments provide support services to the other departments in the plant. Some examples of service departments include purchasing, receiving and storage, engineering, power, maintenance, packing, shipping, inventory control, inspection and quality control. Service department costs must be assigned (applied, allocated, or traced) to the inventory for product costing purposes.
THREE WAYS TO ASSIGN SERVICE DEPARTMENT COSTS
In general, there are three ways to assign service department costs and other overhead costs to products. These include: 1) using a single plant wide overhead rate, 2) using separate departmental overhead rates and 3) using several activity based overhead rates in each department. The third method is frequently referred to as activity based costing.
A Single Plant Wide Overhead Rate
The simplest approach involves combining all overhead costs so that a single plant wide overhead rate can be calculated and used to apply overhead to products. The distinction between service areas and producing areas is ignored and the entire plant is treated as a single department. For example, when we applied factory overhead to products in Chapter 4 we were using a single plant wide overhead rate. This simple, one stage approach, is useful for introducing product costing concepts, but it will provide accurate product costs only in cases where the company produces a single product, or a few similar products that consume all services and other indirect resources in the same proportions in every department. If Product X consumes 10 percent of one indirect resource, it must consume 10 percent of all indirect resources for a single plant wide rate to provide accurate product costs. If a firm produces many different products that consume indirect resources in different proportions, then a two stage approach is needed to provide accurate product costs.
Separate Departmental Overhead Rates: The Traditional Two Stage Approach
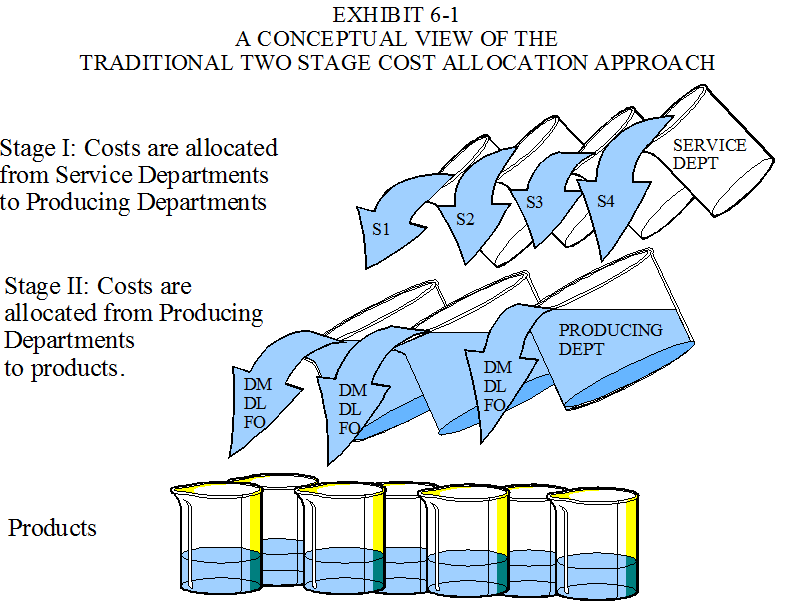
A second method, frequently referred to as the traditional two stage allocation approach, recognizes that there are service areas and producing areas in the plant. In the traditional two stage approach, service department costs are allocated to the producing departments in the first stage and then allocated (applied or traced) to the products produced along with other producing department overhead in the second stage using departmental overhead rates. A conceptual view of the idea is presented in Exhibit 6-1. Usually, only one overhead rate is developed for each producing department, although the basis for these rates may differ between departments. The various producing departments might use direct labor hours, equivalent units, material costs or machine hours, as an allocation basis. In the traditional approach, the activity measures, or allocation bases, are almost always related to production volume (like the four mentioned in the previous sentence). This traditional approach will provide accurate product costs if each producing department produces (or partially produces) a single product, or a few similar products, that consume all indirect resources within a department in the same proportion and in proportion to the allocation basis used. If Product X consumes 20 percent of one indirect resource within a department, it must consume 20 percent of all of the indirect resources within the department and the allocation basis must reflect this percentage. Otherwise a single departmental rate will not provide accurate product costs.

When a department produces (or partially produces) many different products and some of the products consume different indirect resources in different proportions, a more involved method is needed to provide accurate product costs. For example, if Product X consumes 30 percent of the power, 15 percent of the engineering work and 20 percent of the maintenance activity in Department A, then a single departmental overhead rate would distort product costs. This is because a single activity measure, or allocation basis can only represent one of these percentages. If the company uses machine hours as a basis, then power costs might be accurately traced to Product X, but the product would be overcharged with engineering and maintenance costs.
Multiple Activity Based Overhead Rates For Each Department
A third method, referred to as activity based product costing, also involves a two stage allocation process where the first stage is essentially the same as in the traditional two stage approach. However, in the second stage of the ABC approach, overhead costs are separated into cost pools so that different types of costs can be traced to products more accurately using different types of activity measures. While some of the activity measures may be related to production volume, other non-production volume related activity measures are also used. Using the example in the section above, Department A might use machine hours to allocate power costs, the number of engineering work orders to allocate engineering costs and perhaps some measure of maintenance time to allocate maintenance costs. These generalizations are summarized in Exhibit 6-2.This chapter focuses on the traditional two stage cost allocation approach and the manner in which this approach eliminates the distortions that tend to occur when a single plant wide rate is used. The two stage activity based costing approach is illustrated in Chapter 7 and focuses on eliminating the distortions that tend to occur when the traditional two stage approach is used.
| Exhibit 6-2 Applicability of Overhead Allocation Methods |
||||
| Method of Assigning Overhead |
Number of Stages |
Type of Allocations |
Basis of Overhead Rates |
When Applicable |
| Single Plant Wide Rate |
1 | From a
single aggregated cost pool to products. |
A
production volume related activity measure, e.g., direct labor hours, machine hours etc. |
Plant produces only one, or a few similar products that consume all indirect resources in the same proportions, e.g., Product X consumes 10% of each indirect resource in the plant. |
| Single Rate Per Department | 2 | From
service departments to producing departments' single cost pools
(overhead accounts), to products. |
A
production volume related activity measure. These may be different
for each department. |
Each department produces only one, or a few similar products that consume all of a department's indirect resources in the same proportions, e.g., Product X consumes 20% of all indirect resources in Department A, 10% of all indirect resources in Department B, etc. |
| Multiple Activity Based Rates Per Department | 2 or More | From
service departments, to producing departments' activity cost pools,
to products. |
Both
production volume related and non-production volume related activity
measures, e.g., number of purchase orders, number of setups, etc. |
Each department produces many products that consume resources within each department in different proportions, e.g., Product X consumes 30% of the power, 15% of the engineering work and 20% of the repair in Department A. Multiple rates are needed in Department A. |
TYPES OF RELATIONSHIPS BETWEEN SERVICE DEPARTMENTS
First stage allocations may include self services and reciprocal services between service departments, as well as services to producing departments. Self service refers to situations where service departments use some of their own service. For example, the power department uses some power and the maintenance department requires some maintenance. Reciprocal services refer to situations where two or more service departments provide services to each other. For example, the power department provides electric power to the maintenance department and the maintenance department provides repair and maintenance to the power department. These relationships affect the choice of allocation methods, as well as the accuracy of the first stage cost allocations.
THREE METHODS FOR STAGE I ALLOCATIONS
There are three methods for allocating service department costs to producing departments. These include: 1) the direct method, 2) the step-down or sequential method and 3) the reciprocal method. Each method includes developing a set of equations to represent the relationships involved and then solving the equations to generate the desired cost allocations. The equations may be developed for each approach using the proportions of service that each department uses, or using charging rates (activity rates) for each service department. Since it is easier to use proportions when there are only a few departments, proportions are used to introduce the topic. The two equations presented below are developed for each of the three approaches.
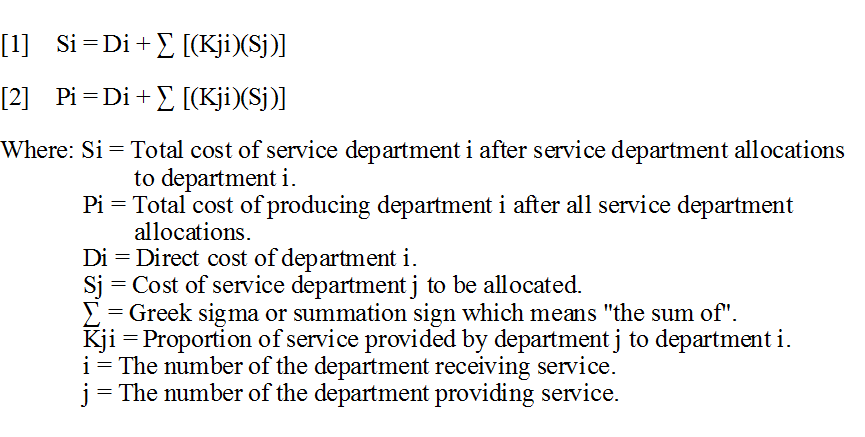
Direct costs (D) refers to the costs that are incurred within each department. Thus, the equations show that the total costs of a producing department includes the department's direct cost (Di), plus the allocations from the various service departments (i.e., the sum of [(Kji)(Sj)]). Normally the number of service departments indicates the number of allocations to each producing department. However, the number of allocations to the service departments depends on the allocation method and the extent of the self services and reciprocal services involved.
The Direct Method
The direct method simplifies the allocation process by ignoring self services and reciprocal services between service departments. As a result, Equation [1] takes on the form Si = Di = Sj since the proportions (Kji) of service provided internally and to other service departments are ignored.
This approach is accomplished in two steps. The first step involves developing equations to reflect the relationships between the service departments and the producing departments, i.e., equation form [2] presented above. After these equations are developed, they are used to allocate the service department costs directly to the producing departments in the second step. Although this is the simplest method, it is also the least accurate method.
The Step-Down or Sequential Method
The step-down, or sequential method, ignores self services, but allows for a partial recognition of reciprocal services. As a result, the step-down method is different from the direct method in that some service department costs are allocated to other service departments. Thus, both equations [1] and [2]) are needed. Equations for the service departments [1] are developed to allocate the service department costs in sequence starting with the department that serves the greatest number of other service departments. An alternative approach is to start with the service department that provides the highest percentage of its’ service to other service departments. In determining the sequence of allocations, ties can be broken by using the alternative approach. If there is still a tie, then choose the department with the largest dollar amount of service provided to the other service departments. In the step-down method, no costs are allocated (or reallocated) back to a service department once the service department’s costs have been allocated.
The step-down method is also accomplished in two steps. In the first step, a set of equations is developed to represent the relationships between the service departments and the other departments, i.e., both sets of equations [1] and [2]. Then the equations for the service departments [1] must be solved before the allocations to the producing departments [2] can be completed. The service department equations reflect the fact that the number of allocations to each service department changes as the departments are closed in sequence. If there are "n" service departments numbered according to the sequence in which they are closed, then there would be no allocations to the first service department closed, therefore S1 = D1; only one allocation to service department 2, therefore S2 = D2 + K1,2; two allocations to service department 3, therefore S3 = D3 + K1,3 + K2,3 and finally n-1 allocations to the last (nth) service department.
In the second step, the equations for the service departments are solved first in the sequence established by the rules mentioned above. Then the equations representing the producing departments are solved to provide the desired allocations. The step-down method is more accurate than the direct method, but less accurate than the reciprocal method.
The Reciprocal Method
The reciprocal method is more accurate than the other two methods because it fully recognizes self services and reciprocal services between service departments. However, this method is more involved because it requires the solution to simultaneous equations. The reciprocal method includes three steps as follows.
1) Develop equations for each department fully recognizing all the reciprocal relationships and self services. The equations for the reciprocal method are also developed from equations [1] and [2] above. However, there are some differences in the values that appear in the equations. First, the service department costs (Si and Sj) are different because all of the self service and reciprocal relationships are considered in determining these amounts. In addition, the proportions (Kji) in both sets of equations are different for the same reason. The proportions reflect all of the relationships in the reciprocal method, instead of only part of the relationships as in the step-down method.
2) Solve the system of equations for the service departments [1] simultaneously. Although simple problems with two or three unknowns in each equation can be solved by hand, computer programs are required to solve the equations in realistic situations.
3) Solve the equations developed in [2] to determine the allocations to the producing departments.
The three methods for stage 1 allocations are illustrated in the example provided below.
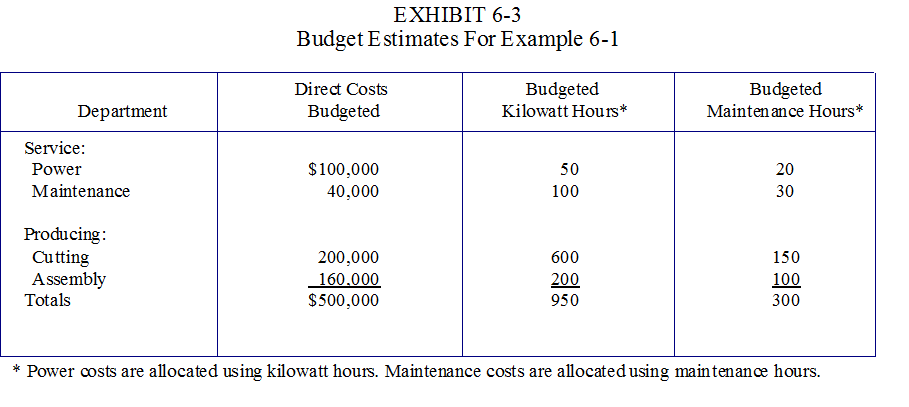
The Cutright Company has a small factory with two service departments and two producing departments. The service departments, Power and Maintenance provide support to the producing departments, Cutting and Assembly, to each other and also use some of their own services. Budget estimates are provided Exhibit 6-3. These estimates are used to develop predetermined departmental overhead rates for the Cutting and Assembly departments.
The following symbols are used to develop equations for each approach.
S1 = Total cost of the Power Department after all service department allocations to Power.
S2 = Total cost of the Maintenance Department after all service department allocations to Maintenance.
P1 = Total cost of the Cutting department after all service department allocations to Cutting.
P2 = Total cost of the Assembly department after all service department allocations to Assembly.
Allocations Based on the Direct Method
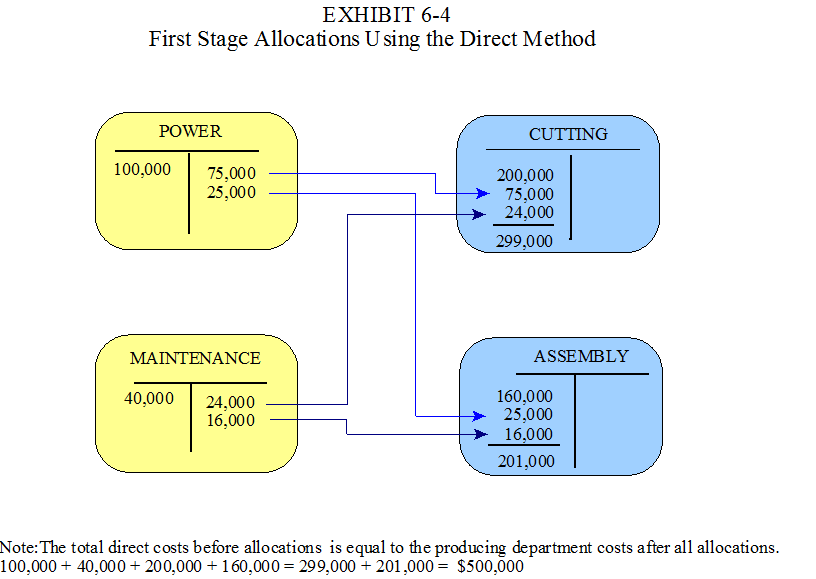
The first stage cost allocations based on the direct method are performed as follows using equations [1] and [2]:
S1 = 100,000 and S2 = 40,000 since self services and reciprocal services are ignored.
P1 = 200,000 + (600÷800)(S1) + (150÷250)(S2)
= 200,000 + (6÷8)(100,000) + (15÷25)(40,000)
= 200,000 + 75,000 + 24,000
= $299,000
P2 = 160,000
+ (200÷800)(S1) + (100÷250)(S2)
= 160,000 +
(2÷8)(100,000) + (10÷25)(40,000)
= 160,000 + 25,000 +
16,000
= $201,000
The self services (the 50 KWH's used by S1 and the 30 labor hours used by S2) are ignored along with the reciprocal services (the 100 KWH's used by S2 and the 20 labor hours used by S1) in developing the proportions. Thus, the denominator for developing the proportions for S1 is 800, not 950 and the denominator for developing the proportions for S2 is 250, not 300.
These allocations are illustrated in Exhibit 6-4. The total producing department costs, after all allocations, is equal to the total direct costs budgeted, i.e., $500,000 (See the note at the bottom of Exhibit 6-4).
Allocations Based on the Step-Down Method
In Example 6-1, both service departments serve each other, but the Power Department provides a larger proportion of its’ service to maintenance (100÷950 = .105) than the proportion the Maintenance Department provides to Power (20÷300 = .066). Therefore, the Power Department costs are allocated first. The relationships are developed from equation [1] in the following manner:
S1 = 100,000 since S1 is closed first.
S2 = 40,000 + (100÷900)(S1)
= 40,000 + (1÷9)(100,000)
= 40,000 + 11,111.11
= $51,111.11
Observe that the denominator for the proportion of service provided from S1 to S2 is 900, not 950. This is because the 50 KWH's of self service are ignored in the step-down method.
Next, the allocations to the producing departments are developed from equation [2] as follows:
P1 = 200,000 + (600÷900)(S1) + (150÷250)(S2)
= 200,000 + (6÷9)(100,000) + (15÷25)(51,111.11)
= 200,000 + 66,666.67 + 30,666.67
= $297,333.34
P2 = 160,000 + (200÷900)(S1) + (100÷250)(S2)
= 160,000 + (2÷9)(100,000) + (10÷25)(51,111.11)
= 160,000 + 22,222.22 + 20,444.44
= 202,666.66
The denominator for the proportions of service provided from S1 to P1 and P2 is 900, not 950 and the denominator for the proportions of service provided from S2 to P1 and P2 is 250 not 300. This is because the self service hours are ignored as well as the 20 hours provided to Power. Since the Power Department has already been closed, no costs are allocated from Maintenance to Power.
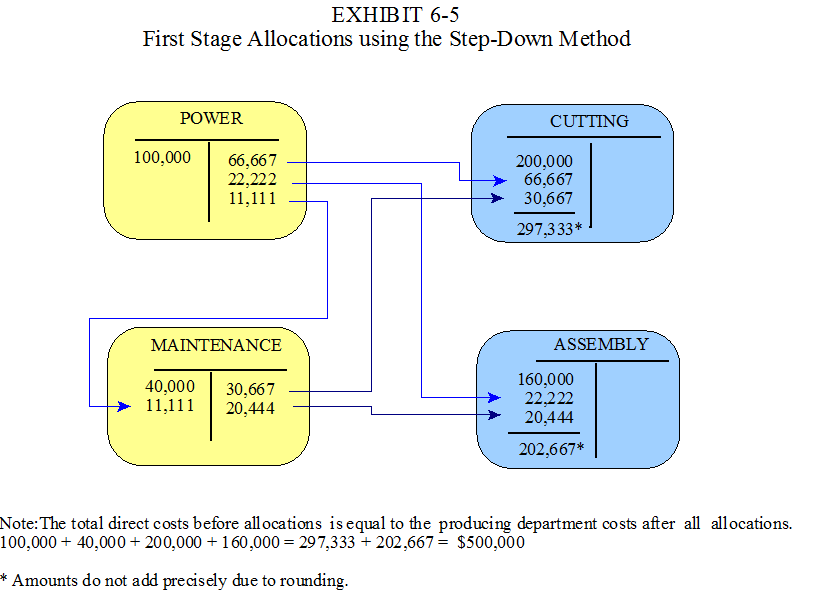
The allocations for the step-down method are presented in Exhibit 6-5. As indicated in the exhibit, $11,111 of Power Department costs is allocated to the Maintenance Department recognizing that 100 kilowatt hours of power were used by Maintenance. This improves the accuracy of the allocations to both producing departments by $1,667 which represents about a 5.57% decrease for Cutting and about an 8.29% increase for Assembly.
Allocations Based on the Reciprocal Method
In the reciprocal method, the equations for the service departments must reflect all of the reciprocal relationships as well as self service (See the original data in Exhibit 6-3). Using equation [1], the relationships for the service departments are as follows:
S1 = 100,000 + (50÷950)(S1) + (20÷300)(S2)
S2 = 40,000 + (100÷950)(S1) + (30÷300)(S2)
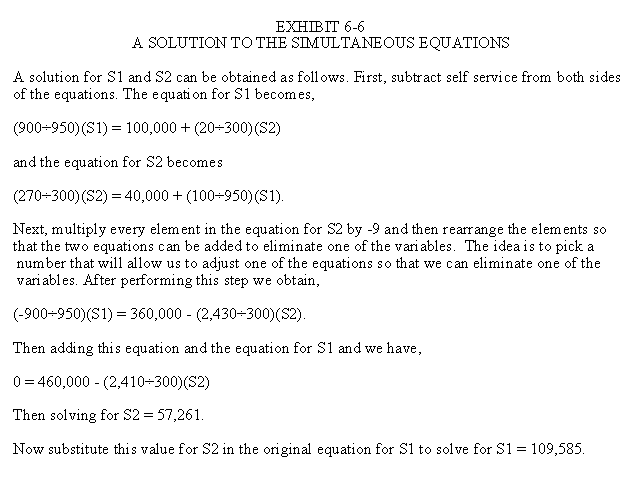
Each of these equations includes two unknowns, thus determining S1 and S2 requires solving the equations simultaneously. Although simultaneous equations are not normally solved by hand in practice, one method is presented in Exhibit 6-6 to illustrate the concept.
Since the relative difficulty of solving simultaneous equations expands rapidly when additional service departments are involved, solutions to simultaneous equations are usually obtained using computer software designed for this purpose.
After the simultaneous equations have been solved, the allocations to the producing departments are easily determined by hand as follows.
P1 = 200,000 + (600÷950)(S1) + (150÷300)(S2)
= 200,000 + (600÷950)(109,585) + (150÷300)(57,261)
= 200,000 + 69,211.58 + 28,630.5
= $297,842
P2 = 160,000 + (200÷950)(S1) + (100÷300)(S2)
= 160,000 +
(200÷950)(109,585) + (100÷300)(57,261)
= 160,000 + 23,070.53 + 19,087
= $202,158
We can also fill in the original equations for the service departments to find the reciprocal transfers. Although the specific amounts of the reciprocal transfers are not needed to complete the allocations to the producing departments, they are needed so that entries can be made to record the transfers between the service departments.
S1 = 100,000 + (50÷950)(S1) + (20÷300)(S2)
= 100,000 + (50÷950)(109,585) + (20÷300)(57,261)
= 100,000 + 5,768 + 3,817
= $109,585
S2 = 40,000 + (100÷950)(S1) + (30÷300)(S2)
= 40,000 + (100÷950)(109,585) + (30÷300)(57,261)
= 40,000 + 11,535 + 5,726
= $57,261
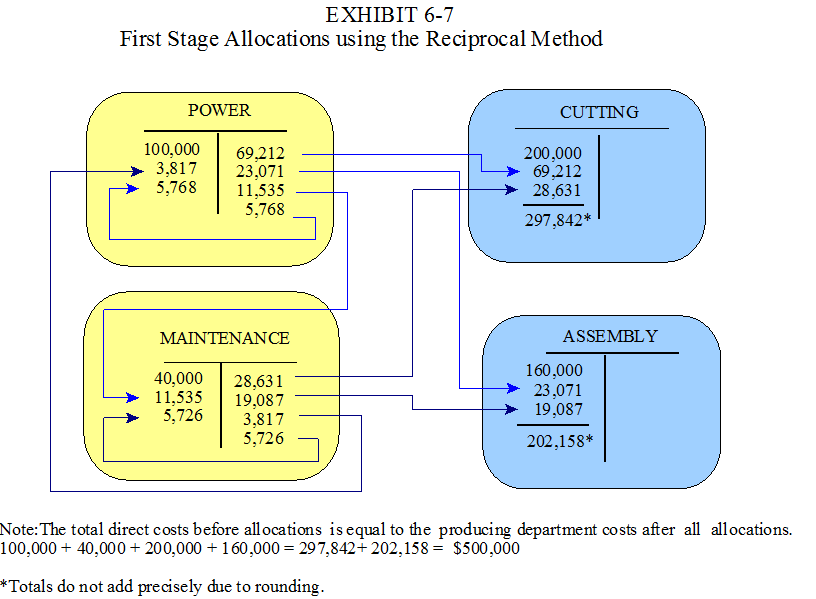
A complete picture of the reciprocal allocations appears in Exhibit 6-7. In addition to the allocations to Cutting and Assembly, the Power Department allocates $11,535 to Maintenance and $5,768 to itself, while the Maintenance Department allocates $3,817 to the Power Department and $5,726 to itself. There may appear to be some double counting in the Power and Maintenance Departments, but this a normal result when solving simultaneous equations. When we compare the original direct costs before allocations to the producing department costs after all allocations, it is clear that the double counting has not caused an overstatement in the final results. The total producing department cost after all allocations is equal to $500,000 as indicated at the bottom of Exhibit 6-7.
Comparing the Allocations from the Product Cost Perspective
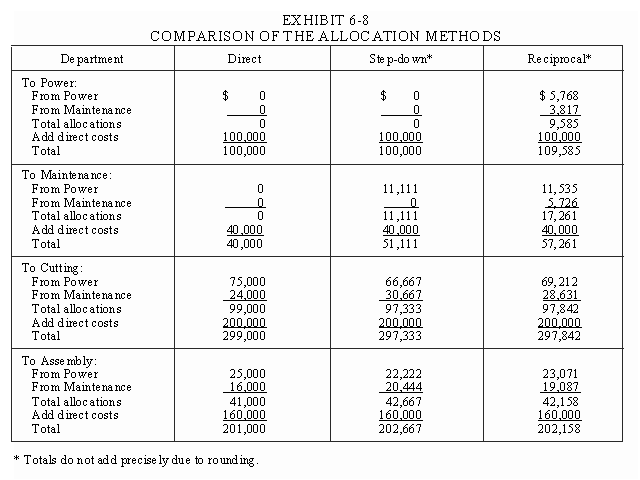
The cost allocations for the three methods are compared in Exhibit 6-8. These comparisons show that the differences between the final allocations for the direct, step-down and reciprocal methods are fairly insignificant from the producing department, or product cost perspective. For example, the differences in the allocations when using the step-down method, rather than the more accurate reciprocal method are only $509 for both Cutting (i.e., 297,842 - 297,333) and Assembly (i.e., 202,667 - 202,158). This represents a 1.7% understatement for the Cutting Department and a 2.5% overstatement for the Assembly Department. These offsetting differences will not create significant differences in the unit costs of Cutright Company’s products. Therefore, from the product cost perspective, the step-down method is acceptable in this case and in many real world situations. However, it is always best to make a comparison, rather than assume that the step-down method is acceptable.
Comparing the Allocations from the Service Cost Perspective
From the service cost perspective, the differences are more significant. Both the direct and step-down methods understate power costs by $9,585, or approximately 9.6%. On the other hand, maintenance costs are understated by $17,261 using the direct method and $6,150 using the step-down method. These differences are likely to be significant in terms of evaluating the service department costs, particularly in cases where a "make or buy" (outsourcing) decision is involved.
For example, suppose the Cutright Company can hire a subcontractor to provide maintenance for $175 per hour. Consider the decision using the three allocation methods. Based on the direct method, the current cost per hour is only $40,000÷300 hours =$133.33 (Amounts are from Exhibits 6-3 and 6-8). Outsourcing maintenance work appears to be too costly. Based on the step-down method, the cost per hour is $51,111÷300 = $170.37, still below the sub-contractor’s price. However, using the reciprocal method, the current hourly cost is $57,261 ÷ 300 = $190.87. This calculation correctly indicates that outsourcing the company’s maintenance work will provide a cost savings, although the precise amount to be saved is more difficult to determine.1 The main point however, is that the reciprocal method is likely to be important for decisions concerning a company’s services, even though it may not be very important for decisions concerning a company’s final products. Any generalizations beyond this are risky. The best advice is to perform the analysis.
THE DUAL RATE OR FLEXIBLE BUDGET ALLOCATION METHOD
The dual rate or flexible budget method refers to using separate rates, or allocations for fixed and variable service costs. The purpose of this method is to prevent the actual cost allocations to users from being influenced by the quantity of service consumed by other users. Allocating fixed and variable service costs using a single actual rate can result in a variety of cost distortions. For example, situations arise where a user’s budgeted and actual consumption of a service are the same, but the actual service cost allocation to the user is greater than the budgeted allocation.
To illustrate the advantages of the dual rate or flexible budget method, consider the revised information that appears in Exhibit 6-9. This exhibit shows the same data that appears in Exhibit 6-3 except service costs are separated into fixed and variable elements.
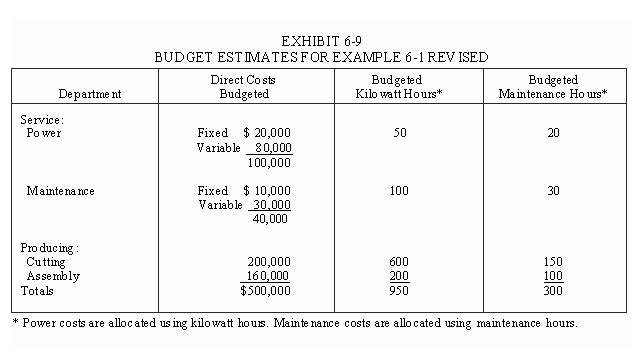
To simplify the illustration, we will use the direct method for service cost allocations and ignore maintenance costs. Budgeted power cost allocations based on the dual rate concept are presented in Exhibit 6-10. Fixed costs are allocated in proportion to the original capacity available to the user departments. Variable costs are allocated using a rate of $100 per kilowatt hour.
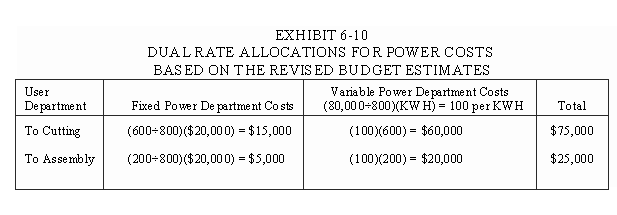
The flexible budget equations are $15,000 + ($100)(KWH) for Cutting and $5,000 + ($100)(KWH) for Assembly. Now, suppose the actual number of kilowatt hours consumed during the period was 600 for Cutting, but only 150 for Assembly. Assuming the actual power costs incurred were in portion to the actual demand, power costs are $20,000 + ($100)(750 kilowatt hours) = $95,000. Then the single actual rate is $95,000÷750 = $126.6667. The allocations based on this single rate and the dual rate method are compared in Exhibit 6-11.
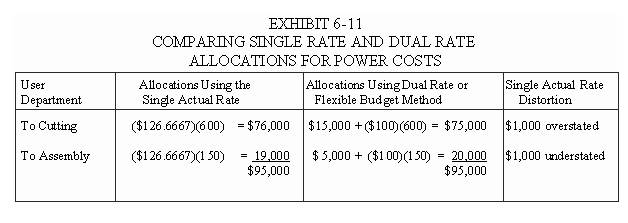
Exhibit 6-11 shows that when the single actual rate method is used to allocate the actual power costs, the allocation to the Cutting Department increases from the original $75,000 to $76,000 even though the Cutting Department consumed the same number of kilowatt hours that were estimated in the budget. The extra $1,000 allocation to Cutting is caused by the reduction in kilowatt hours used by Assembly which increases the proportion (but not the absolute amount) of the power used by Cutting. Therefore, when the single actual rate method is used, $1,000 of the fixed power costs originally associated with the Assembly Department is shifted to the Cutting Department. However, using the dual rate method avoids this cost distortion by allocating the fixed power costs in the manner originally established.
From the performance evaluation and behavioral perspectives, the amount of fixed service cost allocated to a user is more meaningful if it is not influenced by variations in the short term consumption levels of other users. The dual rate method simply provides a way to implement this idea which reduces the inevitable behavioral conflicts created by the cost allocation process. Another advantage of the dual rate method is that spending variances for both fixed and variable costs can be calculated when the actual service costs differ from budgeted costs. A disadvantage of using the dual rate method is that idle capacity costs for the service departments are allocated to the user departments. This problem is eliminated by using the single budgeted rate method illustrated below.
THE SINGLE BUDGETED RATE METHOD
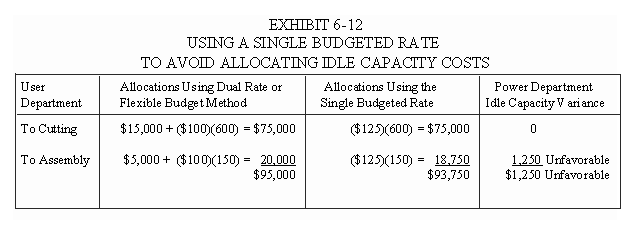
The Assembly Department manager is likely to complain that neither of the allocations in Exhibit 6-11 is equitable. He or she might logically argue that the dual rate method illustrated above assigns the Power Department’s idle capacity costs to the Assembly Department. These idle capacity costs will in turn be allocated to the Assembly Department’s products. Using a single budgeted rate, rather than either a single actual rate or dual rate (Exhibit 6-11) will normalize the service costs allocations, provide more timely costing and aid in evaluating the service departments. Conceptually, this is the same logical argument discussed in Chapter 4 under the heading of reasons for using a predetermined overhead rate.
Assuming the direct method is used, the single budgeted rate for power costs is $125 ($100,000÷800 kilowatt hours). Allocations based on this single budgeted rate are presented in Exhibit 6-12 along with the dual rate allocations presented above. The allocation to Cutting is still $75,000, but the allocation to Assembly decreases from $20,000 to $18,750. The $1,250 difference represents the idle capacity costs associated with the Power Department. Referring back to Exhibit 6-11, we can see that the single actual rate method is the least acceptable of the three alternatives because most of the idle capacity costs are allocated to the Cutting Department. On the other hand, the single budgeted rate method is preferable because it avoids allocating the idle capacity costs to either department by normalizing the amount of service costs allocations. It also provides more timely information for product costing and more useful information for monitoring service department costs. When actual service department costs (fixed and variable) are different from the budgeted costs, as they invariably are, a spending variance can also be calculated for each service department. This also improves the cost system from the performance evaluation and behavioral perspectives since these variances would otherwise be shifted to the producing departments.
SUMMARY OF THE SERVICE DEPARTMENT ALLOCATION ALTERNATIVES
The three alternative methods of allocating service department costs to users are summarized in Exhibit 6-13. Method number 3 is recommended from both the behavioral perspective and the performance evaluation perspective since it avoids shifting fixed costs from one user to another, avoids assigning idle capacity costs to users and provides a way to evaluate the service departments using the variance analysis introduced in Chapter 4.
COMPARING DEPARTMENTAL AND PLANT WIDE RATES IN STAGE II
At the beginning of this chapter it was stated that a plant wide overhead rate would provide accurate product costs only in cases where the company produces a single product, or a few similar products that consume all indirect resources in the same proportions in every department. If different products consume indirect resources in different proportions in the various departments, then using departmental overhead rates will provide more accurate product costs than using a plant wide rate. The example presented below illustrates this concept.
To show how a single plant wide overhead rate can distort product costs, assume that the firm in Example 6-1 produces two products, X1 and X2. Recall from the example that there are two producing departments, Cutting and Assembly. Although each product passes through both departments, the products do not consume the department resources in the same proportions. As indicated in Exhibit 6-14, X1 requires a larger proportion of cutting time, while X2 requires a larger proportion of assembly time.
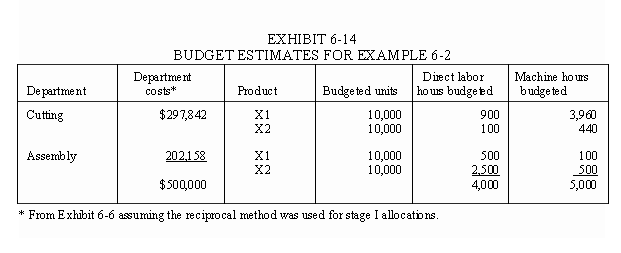
To simplify the example, assume that the first stage cost allocations have already been performed using the reciprocal method as indicated in Exhibit 6-7, thus we are ready to choose a method for the Stage II allocations. Since it is not clear how these allocations should be performed to obtain more accurate product costs, we will examine three possible alternative methods.
Departmental Versus Plant Wide Rates
Departmental overhead rate allocations are illustrated in the top section of Exhibit 6-15. Although machine hours are used for these allocations, departmental rates based on direct labor hours would provide the same results because the products require direct labor hours and machine hours in the same proportions within each department. The allocations for two plant wide rate alternatives are shown in the lower section of the table. The notes to the table show how the overhead rates were calculated in each case.
The three allocation methods in Exhibit 6-15 produce very different results. For example, the costs allocated to X1 are either $301,751 using departmental rates, or $175,000, or $406,000 using the two plant wide rate alternatives. The key questions in this illustration are which of these methods produces the more accurate product costs and why are the product costs obtained using this method more accurate?
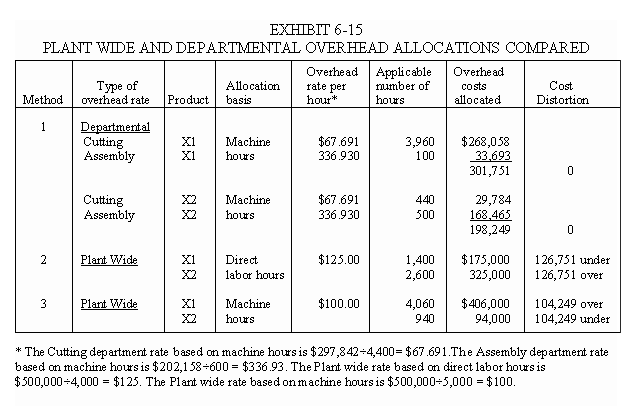
The answers to these questions are found by examining the proportions of the resources consumed by each product in each department. Since X1 consumed 9/10 of the machine time in the Cutting department, (i.e., 3,960÷4,400) it seems logical that X1 should receive 90 percent of the overhead costs. Assigning 90% of the Cutting Department overhead costs to X1 will provide accurate product costs if all the indirect resources in the Cutting Department (i.e, power, maintenance and the resources represented by the department's direct costs) are consumed in proportion to machine time.
Moving to the Assembly department, X1 consumed 1/6 of the machine time in Assembly, (i.e., 100÷600) thus, it should logically receive 1/6 of the overhead costs. Assigning 1/6 of the Assembly department's overhead costs to X1 will provide accurate product costs if all the indirect resources in this department are consumed in proportion to machine hours. Then the total allocation to X1 is (9÷10)(297,842) + (1÷6)(202,158) = 268,058 + 33,693 = $301,751. Using this same logic, the allocations to X2 are (1÷10)(297,842) + (5÷6)(202,158) = 29,784 + 168,465 = $198,249. Exhibit 6-15 shows that these are the same amounts that are obtained when using the departmental rates.
Summary of Key Point
The plant wide rates provide inaccurate product costs because the products do not consume the indirect resources in the same proportions in each of the two departments. For a plant wide rate to provide the same results as departmental rates, each product would have to consume the same proportion of the resources in every department. If X1 consumed 9/10 of the machine time in both departments and X2 consumed the other 1/10, then a plant wide rate, based on machine time, would provide the same results obtained using departmental rates.2 However, since X1 consumes 9/10 of the machine time in Cutting and 1/6 of the time in Assembly, while X2 consumes 1/10 of the time in Cutting and 5/6 in Assembly, separate departmental rates are needed to provide more accurate product costs.
Another way to analyze the problem caused by using a plant wide rate is to examine the overall indirect resource consumption proportions. On a plant wide basis, X1 consumes only slightly more than 60 percent of the indirect resource costs in the plant (i.e., 301,751÷500,000 = .6035) and X2 consumes a little less than 40 percent (i.e., 198,249÷500,000 = .3965). The plant wide rates produce inaccurate results because X1 consumes 35 percent of the direct labor hours in the plant (i.e., 1,400÷4,000) and 81.2 percent of the machine hours (i.e., 4,060÷5,000). Thus, on a plant wide basis, neither the consumption of direct labor hours or the consumption of machine hours accurately reflects the overall resource cost consumption. If we use direct labor hours as a basis for a plant wide rate, we will overstate the cost of the labor intensive product X2 by $126,751 (325,000 - 198,249) and understate the cost of the machine intensive product X1 by $126,751 (301,751 - 175,000). On the other hand, if we use machine hours as a basis for a plant wide rate, we will overstate the cost of the machine intensive product X1 by $104,249 (i.e., 406,000 - 301,751) and understate the cost of the labor intensive product X2 by $104,249 (i.e., 198,249 - 94,000).
APPENDIX 6-1
JOINT AND BY-PRODUCTS
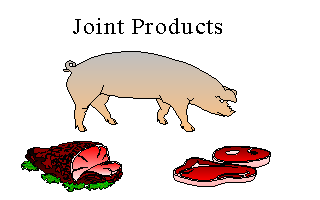
The term "joint products" refers to a group of products that are produced simultaneously by a common process. A group of joint products is inseparable until the products reach a certain point where they are divided or split into separate products. This point is frequently referred to as the split-off point. Producing more of one product in the group means producing more of all products in the group. The key characteristic is that the products cannot be obtained separately. For example, the lumber products derived from a tree are joint products. The products obtained from a hog such as the chops, ham, and bacon are joint products. In fact, joint products are common in a variety of industries including petroleum, flour milling, meat packing, dairy, coal, copper, salt, chemicals, soap, gas, leather, and tobacco. The term "by-products" refers to a sub-category of joint products that have relatively insignificant sales values as a proportion of the value of the entire group from which they are derived.
The accounting techniques that relate to joint and by products are placed in this chapter because these products create special cost allocation problems for system designers. However, this section is placed in an appendix because it represents a sideline topic in the sense that it can be omitted without interfering with the flow of the learning process.
Problems arise for system designers because the "joint costs", (i.e., the costs associated with producing a group of joint products prior to the point of separation) cannot be allocated using the "cause and effect" logic. There is no accurate way to determine the amount of joint cost that is caused by any particular joint product. For example, it is not feasible to determine how much of the costs associated with the care and feeding of a hog is required to produce the bacon. This is because the bacon cannot be obtained without the rest of the hog. Even so, the joint cost allocations need to be performed to accomplish some of the purposes discussed above such as inventory valuation and income determination for external reporting. The methods that are available for allocating joint costs are discussed below along with the advantages and disadvantages of each method.
METHODS OF ACCOUNTING FOR JOINT COSTS
Joint costs can be accounted for in a variety of ways. Four alternates for allocating joint costs include allocating the costs on the basis of 1) the physical quantities, 2) the actual sales values at the split-off point, 3) the net realizable values at the split-off point and 4) the net realizable values reduced by an average, or overall profit margin. Another possible alternative is not to allocate the joint costs.
Allocations Based on Physical Quantities
One approach involves allocating the joint costs in proportion to a physical measure such as the number of pounds, gallons, liters, or board feet associated with each joint product at the split-off point. While this intuitively appealing approach may appear to follow the "cause and effect", or "benefits received" logic, it is in fact arbitrary and indefensible from either perspective.3 In addition, the allocations based on physical measurements tend to generate cost allocations to some joint products that exceeds their market values. This creates a problem for both accounting and product managers. For example, when the inventory values for some joint products exceed their market values, adjustments are required following the conservative "lower-of-cost-or-market"rule4. Of course these products appear to be unprofitable at the split-off point which tends to cause some confusion concerning whether to process the products beyond the split-off point and how to price the products.
Allocations Based on Actual Sales Values at the Split-off Point
If the joint products have defined sales values at the point of separation, i.e., are marketable at this point without further processing, then the joint cost can be allocated in proportion to these values. This approach follows the "ability to bear" the cost logic. Although it may not seem "fair and equitable" to the products involved, this method is expedient since a "cause and effect" or "benefits received" determination is not feasible. In addition, allocating joint cost based on sales values at the split-off point can be defended on the grounds that it produces equal profit percentages at the point of separation, which eliminates the problems associated with using physical quantities as the allocation basis. The method avoids the inventory valuation problem discussed in the section above and is less objectionable from the decision perspective. Although the allocations are not useful for management decisions, they are less likely to mislead management by implying that the joint products should be treated as separate entities prior to the split-off point.
Allocations Based on Net Realizable Values at the Split-off Point
Net realizable value (NRV)refers to a product’s estimated sales value at the split-off point. These estimates are frequently used when an actual sales value at the split-off point does not exist, or cannot be obtained. A net realizable value is calculated for each product by subtracting the after split-off costs (i.e., costs required to convert the product to a marketable condition) from the final sales value. In equation form,
Net Realizable Value = Final sales value - After split-off costs.
This approach involves allocating the joint costs to products in proportion to these estimated sales values. It provides an alternative to the previous approach when the products can not be sold at the split-off point, i.e., without further processing. However, allocations based on net realizable values are less defensible than allocations based on actual sales values because of the implication that all income from joint product sales is generated by the joint processing activities. The net realizable value method implies that the increase in sales value from the split-off point to the time of sale is only equal to the after split-off costs. Since this is not likely to be an accurate assumption concerning the values added by the separate joint and after split-off processes, the NRV estimates of values at the split-off point are likely to be misstated. However, if there are no identifiable sales values at the split-off point, this method seems to provide the next best alternative.
Allocations Based on Net Realizable Values Less an Average Gross Profit Margin
This approach extends the NRV method by subtracting an average gross profit (GP) margin from the net realizable value to obtain the joint cost allocation. More specifically, the calculations are performed as follows:
Joint cost allocation = Final sales value - After split-off cost - Average gross profit margin
= NRV - (Average GP ratio)(Final sales value for each product)
Average GP ratio = (Combined final sales values-Combined costs)÷Combined final sales values
We can state the equations more precisely using some symbols and subscripts.
JCi = NRVi - (AGP)(FSVi)
Where: JCi = Joint cost allocation to product i.
NRVi = Net realizable value for product i.
AGP = Average gross profit ratio.
FSVi = Final sales value for product i.
The objective of this approach is to create equal gross profit percentages for all joint products. Advocates argue that any attempt to determine gross profit percentages for individual joint products is useless for management decision purposes because the production or discontinuance of individual joint products are not alternatives. The average, or overall profit margin is the relevant measurement for the decision to produce or discontinue the joint process, i.e., produce all or none. However, critics of this method argue that since all joint products are not equally profitable, the joint cost allocation method should not imply that they are5. A counter argument is that all joint cost allocations are arbitrary in that the true profitability of individual products is indeterminable. Therefore, the joint cost allocations should not imply that true profitability has been obtained. Critics rebut the previous argument by pointing out that this method sometimes produces a negative cost allocation to some of the less profitable products (See the example below). Certainly, approximations of the true costs are better than these confusing cross-subsidies. The debate goes on and on.
No Allocations for Joint Cost
From the management decision perspective, joint cost allocations are useless because they are not relevant in decisions concerning the separate products. For example, decisions concerning whether to continue or discontinue producing the joint products depend on their combined value, not the value of any particular product at the split-off point. Therefore, it has been argued that the joint costs should not be allocated at all. However, if the joint costs are not allocated, a value still needs to be placed on the unsold inventory for financial reporting purposes. To solve this dilemma some companies value the inventory at final sales value, less after split-off cost, i.e., NRV. Unfortunately, this method is also criticized because it tends to recognize income before the time of sale. Resolving this conflict leads back to the previous method, i.e., go one step further and subtract an average profit margin. Of course, this leads back to the controversy discussed above.
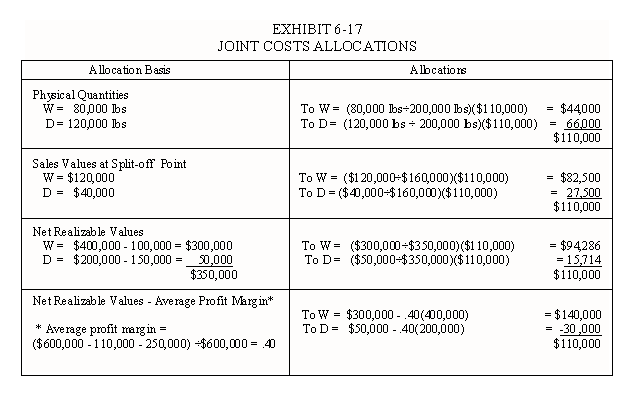
The Virginia Chicken Company combines a poultry business with a chain of restaurants that specialize in southern fried chicken. Two joint products emerge at the point of separation, or split-off point. These products are referred to as white (W) and dark (D) meat. The details for a recent accounting period are provided in Exhibit 6-16. Joint cost allocations are presented in Exhibit 6-17 based on the four allocation methods discussed above.

Allocations Based on Physical Quantities
Notice from Exhibit 6-17 that using the physical quantities of chicken as an allocation basis results in an allocation to product D ($66,000) that exceeds the product’s sales value at the split-off point ($40,000). Of course this creates an inventory valuation problem from the financial reporting perspective as indicated above. In addition, these allocations have some rather senseless implications from the decision perspective, e.g., the company would be more profitable if it produced chickens with only breasts and wings.
Allocations Based on Sales Values at the Split-off Point
The allocations based on sales values at the split-off point (See Exhibit 6-17) are more acceptable from both the financial reporting and decision perspectives. The allocations create equal profit ratios for both products, which insures that the resulting inventory values for both products are below their market values.6 This result will not create any special problems for accounting. From the management decision perspective, these results are not useful, but at least they do not support an incorrect decision with regard to product D.
Allocations Based on Net Realizable Values
The Virginia Chicken Company does not need to use the net realizable value method since this method serves as an alternative when sales values for the products are not available at the split-off point. However, the NRV allocations are presented in Exhibit 6-17 for comparative purposes. Comparing Exhibits 6-16 and 6-17 shows how the sources of value are distorted by this method. The net realizable values imply that the products are worth $350,000 at the split-off point ($300,000 + 50,000) and that the additional value created beyond this point is exactly equal to the additional processing cost of $250,000. However, we can see from Exhibit 6-16 that most of the $600,000 final value ($600,000-160,000 = $440,000 or $440,000÷$600,000 = 73.3%) is created by the distribution and restaurant activities, not the joint processing, i.e., chicken farming activities. Although the NRV method is acceptable from the financial reporting perspective, it confuses the issue of whether to sell the products at the split-off point or process them further. If all the value is created by the joint processing activities, there would be no reason to produce fried chicken. Thus, the NRV method points to an incorrect decision. As indicated above, using the sales values at the split-off point creates equal profit ratios for both products at the split-off point, so that the joint cost allocations will not confuse the issue concerning further processing.
Allocations Based on NRV - Average Profit Margin
Joint cost allocations are presented in the lower section of Exhibit 6-17 based on each product’s net realizable value, less an average gross profit margin. The average profit margin is 40% as indicated on the lower left-hand side of the Exhibit. Therefore, forty percent of each product’s sales value is subtracted from the product’s NRV to obtain the cost allocation, i.e., NRVi - (.40)(FSVi). The allocations produce equal gross profit percentages for each product. However, obtaining equal gross profit percentages produces a negative allocation to product D (-30,000) and an allocation to W that exceeds the total amount of the joint costs (140,000). Another alternative is to allocate $110,000 to W and zero to D, but this does not produce equal gross profit ratios, i.e., the profit ratios will be ($400,000-210,000)÷$400,000 = .475 for W and ($200,000-150,000)÷$200,000 = .25 for D.
Which Allocation Method Should Be Used?
To help answer the question concerning which allocation method the company should use, consider the comparative income statements presented in Exhibit 6-18. If the physical quantities are used, W will show a gross profit of 64% of sales , while D will show an 8% loss. Although some observers may consider this to be a fair and equitable allocation, it is misleading from the management decision perspective because it might be misinterpreted as an indication that the company should dispose of product D at the split-off point. But this is the wrong decision because the company can obtain an additional $10,000 in gross profit if it sells D as fried chicken, i.e., the additional value of $160,000 ($200,000-40,000) less the after split-off costs of $150,000 = $10,000 (See Exhibit 6-16).
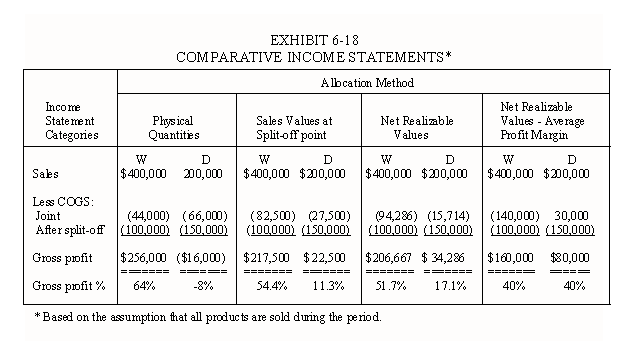
If the company uses the sales value at the split-off point as the allocation basis, the products will appear to be equally profitable at the point of separation. Although some observers might argue that the products are not equally profitable at the split-off point, this method produces allocations that will not tend to confuse the decisions involved. In addition, the inventory values are acceptable from the financial reporting perspective. Thus, from these two perspectives, this method is better than the other three.
The net realizable value method and NRV less an average profit margin method are not needed in this case because the products have identifiable market values at the split-off point. However, the allocations for these methods show the dilemma that system designers face when there are no identifiable values at the point of separation. If we assume that the raw chicken can not be sold, then the net realizable value method appears to be the next best choice.
To Sell or Process Further Decisions
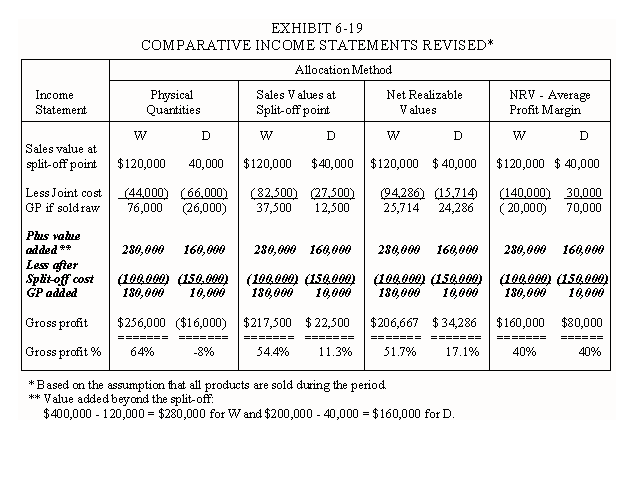
In the sections above, several comments were made in reference to the decision of whether to sell raw chicken or fried chicken. Management decisions concerning whether to sell a product at the split-off point or to process the product further fall into a category referred to as relevant, differential or incremental cost decisions. The key to the correct decision is to only consider the differences between the alternative courses of action. Following this decision rule, the joint costs are not relevant because they will not be different regardless of the decision to sell at the split-off point or to process the products beyond this point. The decision should be based on a comparison of the additional market value created by further processing, with the additional cost required beyond the split-off point. Revised income statements are presented in Exhibit 6-19 to underscore this point. The values added beyond the split-off point are $280,000 for product W and $160,000 for product D. (See the note under the table for these calculations.) These values do not change, regardless of the joint cost allocation method, although the individual gross profit amounts vary widely across the four methods. Clearly, selling both white and dark fried chicken is more profitable than selling either product at the point of separation.
A METHOD OF ACCOUNTING FOR BY-PRODUCTS
There are many ways to account for by-products. We will briefly consider one approach that is similar to the cost reduction method used for scrap (See Chapter 4).
Since the value of by-products is insignificant relative to the main joint products, the by-products are frequently not inventoried. None of the joint costs, or other value is associated with these products until they are sold. Any cost associated with the by-products after the split-off point is charged to cost of goods sold. Then, when the by-products are sold, an entry is made to debit cash and credit cost of goods sold. In this manner the revenue which exceeds the after split-off costs serves as a cost reduction.
For example, suppose the Virginia Chicken Company can sell chicken parts such as feet, beaks and gizzards for five cents per pound at the split-off point. Since these parts of the chicken have relatively little value, they tend to fall into the category of by-products. Suppose the after split-off costs, such as collecting and packaging the parts are estimated to be $25 for 2,000 pounds of feet, beaks and gizzards. Then the entire batch is sold for $100. If the company does not inventory these by-products and uses the cost reduction method, the entries are as follows.
The entry to record the after split-off costs of collecting and packaging is,
COGS 25
Factory overhead 25
and the entry to record
the sale of the by-products is,
Cash
100
COGS
100
These entries reduce cost of goods sold by $75 which is the net amount received from the by-product sales.
_________________________________________
Footnotes
1 The cost savings are the difference between the hourly rates multiplied by the number of maintenance hours that will be needed if the maintenance work is sub-contracted. However, the number of hours needed is approximately 268, not the original 300. To calculate this number, we need to subtract the 30 self-service hours and the reduction in maintenance hours needed by the Power Department. In other words, since power does not have to serve maintenance, power needs less maintenance. The calculation is 300 - 30 -[(100÷ 950)(20)] = 300 - 30 -2.1 = 267.9 hours. The savings are ($190.87-$175)(267.9) = $4,252. These calculations become very complicated and require a computer program designed for this purpose.
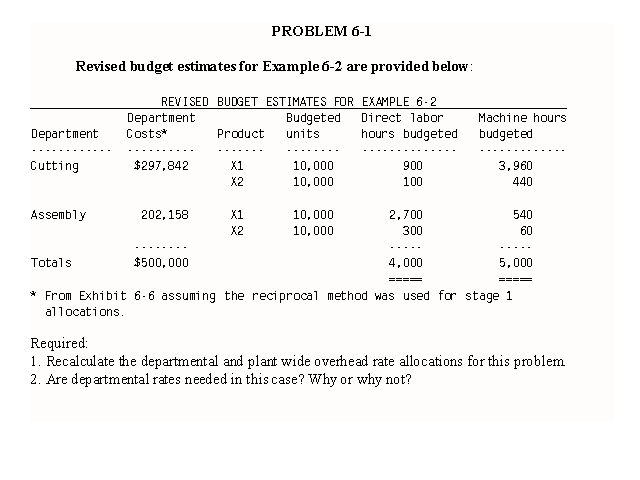
2 This statement can be verified by working Problem 6-1 at the end of this chapter.
3 For example, it is doubtful that any scientific evidence could be obtained to show that the weight of the various parts of a living organism (e.g., a cow, hog, chicken or pine tree) reflects the benefits received by the parts from the care and feeding of the organism.
4 The rule indicates that inventory should be valued at cost or market value, which ever is lower. Market value can be defined as the replacement cost, net realizable value or selling price.
5 A similar, but less severe criticism can be made concerning the allocations based on sales values at the split-off point since this method creates equal profit ratios at the point of separation.
6 The profit ratios are ($120,000- 82,500)÷120,000 = .3125 for product W and ($40,000-27,500)÷$40,000 = .3125 for product D.
1. What are four general purposes of cost allocations? (See Concepts underlying cost allocations).
2. Describe several types of supporting logic for cost allocations methods including the concepts of "cause and effect", "ability to bear" and "fairness and equity". Briefly discuss when each concept appears to be appropriate. (See Concepts underlying cost allocations).
3. In allocating indirect costs to products, when will a plant wide overhead rate provide accurate product costs? (See Exhibit 6-2).
4. When will departmental overhead rates provide accurate product costs? (See Exhibit 6-2).
5. When are activity based overhead rates needed to provide accurate product costs? (See Exhibit 6-2).
6. What does the term traditional two stage allocation process mean? (See Exhibit 6-1 and See the Baggaley & Maskell summary for an illustration of support functions within a manufacturing environment).
7. Which type of overhead rates, plant wide, departmental or ABC are determined using a two stage cost allocation process? (See Exhibit 6-1).
8. Describe the types of relationships between the departments within an organization.
9. What are three methods of allocating service department costs to users?
10. How is the sequence of the service departmental cost allocations determined in the step-down method? (See three methods of allocating).
11. Which stage I cost allocation methods consider reciprocal services? (See three methods of allocating).
12. Which stage I cost allocation methods consider self services?
13. How are the stage I methods ranked in terms of product cost accuracy?
14. Which of the stage I methods is more useful from the service cost perspective, i.e., for "make or buy" decisions? (See Exhibit 6-8 and related discussion).
15. What do we mean by the dual rate method of allocating service department costs?
16. What is the purpose of the dual rate method?
17. Compare the three allocation methods for service department costs including: 1) a single rate based on actual costs, 2) a dual rate based on actual costs and 3) a single rate based on budgeted costs. Briefly discuss the advantages and disadvantages of each method. (See Exhibit 6-13)
18. Discuss how a plant wide overhead rate tends to distort product costs. (See Comparing Departmental and Plant wide rates).
Questions relating to Appendix 6-1
19. Define the terms joint products, by-products and joint costs. (See Joint products).
20. Why do joint costs need to be allocated to the products involved? (See Joint products).
21. Can joint costs be allocated to joint products based on a "cause and effect" relationship? Explain your answer. (See Joint products).
22. List four methods of allocating joint costs.
23. What does the term "net realizable value" mean in terms of joint costs?
24. Describe the conceptual flaw associated with the net realizable value method that relates to where the value added takes place during the production process.
25. Discuss the advantages and disadvantages of the NRV less an average gross profit method of allocating joint costs.
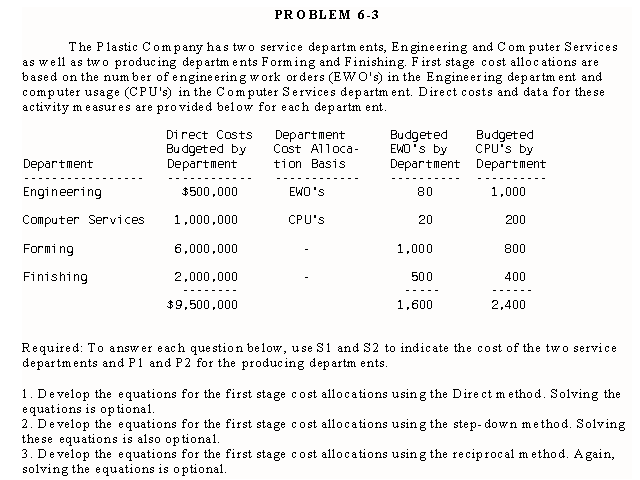
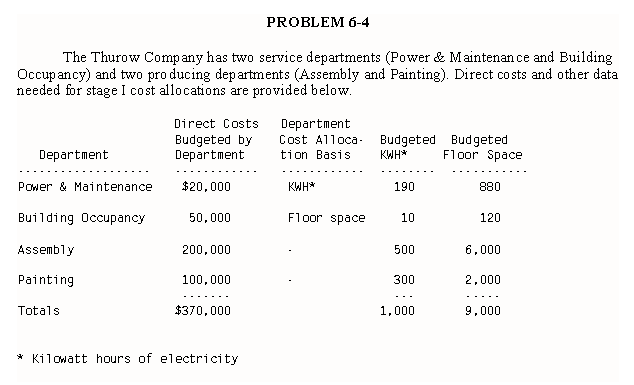
Required:
Circle the letter of the best answer for each of the following questions. Assume that S1 represents the total costs of the Power & Maintenance (P&M) Department after all service department allocations to P&M. S2 refers to the total costs of the Building Occupancy (BO) Department after all service department allocations to BO. P1 represents the total costs of the Assembly Department after all service department allocations. Finally, P2 refers to the total costs of the Painting Department after all service department allocations.
1. Using the Direct method, the total costs of the Assembly Department after all service department allocations could be determined by using which of the following?
a. P1 = 200,000 + (6,000/8,000)(S1) + (500/800)(S2)
b. P1 = 200,000 + (500/800)(S1) + (6,000/8,000)(S2)
c. P1 = 200,000 + (500/1,000)(S1) + (6,000/9,000)(S2)
d. P1 = 200,000 + (500/990)(S1) + (6,000/920)(S2)
e. None of the above.
2. Using the Direct method, the total costs of the Painting Department after all service department allocations would be calculated as follows:
a. P2 = 100,000 + (2,000/9,000)(S1) + (300/1,000)(S2)
b. P2 = 100,000 + (300/1,000)(S1) + (2,000/9,000)(S2)
c. P2 = 100,000 + (300/800)(S1) + (2,000/8,000)(S2)
d. P2 = 100,000 + (300/800)(S1) + (2,000/8,880)(S2)
e. None of these.
3. Using the Step-down method, the total costs of the Power & Maintenance Department after all service department cost allocations to P&M could be determined by using which of the following equations?
a. S1 = 20,000
b. S1 = 20,000 + (190/1,000)(S1) + (880/9,000)(S2)
c. S1 = 20,000 + (880/9,000)(S2)
d. S1 = 20,000 + (880/8,880)(S2)
e. None of the above.
4. Using the Step-down method, the total costs of the Building Occupancy Department after all service department cost allocations to BO could be obtained using which of the calculations below?
a. S2 = 50,000
b. S2 = 50,000 + (10/1,000)(S1) + (120/9,000)(S2)
c. S2 = 50,000 + (10/1,000)(S1)
d. S2 = 50,000 + (10/810)(S1)
e. None of these.
5. Using the Step-down method, the total costs of the Assembly Department after all service department cost allocations could be found using which of the following?
a. P1 = 200,000 + (500/800)(S1) + (6,000/8,000)(S2)
b. P1 = 200,000 + (500/1,000)(S1) + (6,000/9,000)(S2)
c. P1 = 200,000 + (500/800)(S1) + (6,000/8,880)(S2)
d. P1 = 200,000 + (500/810)(S1) + (6,000/8,000)(S2)
e. None of these.
6. Using the Step-down method, the total costs of the Painting Department after all service department cost allocations could be found using which of the equations below?
a. P2 = 100,000 + (300/800)(S1) + (2,000/8,000)(S2)
b. P2 = 100,000 + (300/1,000)(S1) + (2,000/9,000)(S2)
c. P2 = 100,000 + (300/810)(S1) + (2,000/8,000)(S2)
d. P2 = 100,000 + (300/800)(S1) + (2,000/8,880)(S2)
e. None of the above.
7. Using the reciprocal method, the total costs of the P & M Department after all service department cost allocations to P & M could be calculated using which one of these equations?
a. S1 = 20,000
b. S1 = 20,000 + (190/1,000)(S1) + (880/9,000)(S2)
c. S1 = 20,000 + (880/9,000)(S2)
d. S1 = 20,000 + (880/8,880)(S2)
e. None of these.
8. Using the reciprocal method, the total costs of the BO Department after all service department cost allocations to BO could be determined by using which of the following calculations?
a. S2 = 50,000 + (10/1,000)(S1) + (120/9,000)(S2)
b. S2 = 50,000 + (10/1,000)(S1)
c. S2 = 50,000 + (10/810)(S1)
d. S2 = 50,000 + (120/9,000)(S2)
e. None of the above.
9. Using the reciprocal method, the total costs of the Assembly Department after all service department allocations can be found using which of these equations?
a. P1 = 200,000 + (500/800)(S1) + (6,000/8,000)(S2)
b. P1 = 200,000 + (500/1,000)(S1) + (6,000/9,000)(S2)
c. P1 = 200,000 + (500/800)(S1) + (6,000/8,880)(S2)
d. P1 = 200,000 + (500/810)(S1) + (6,000/8,000)(S2)
e. None of these.
10. Using the reciprocal method, the total costs of the Painting Department after all service department allocations can be obtained by which of the following calculations?
a. P2 = 100,000 + (300/800)(S1) + (2,000/8,880)(S2)
b. P2 = 100,000 + (300/810)(S1) + (2,000/8,000)(S2)
c. P2 = 100,000 + (300/1,000)(S1) + (2,000/9,000)(S2)
d. P2 = 100,000 + (300/800)(S1) + (2,000/8,000)(S2)
e. None of the above.
11. Now assume the Thurow Company produces two products as indicated below.
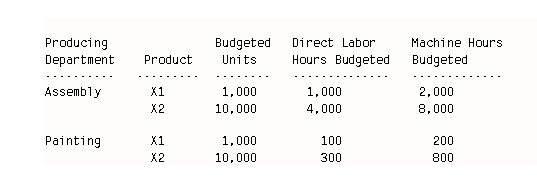
Which of the following statements is true?
a. A plant wide rate based on either direct labor hours or machine hours would provide the same product costs as separate department rates based on these measurements.
b. A plant wide rate based on direct labor hours would provide the same product costs as separate departmental rates based on direct labor hours.
c. A plant wide rate based on machine hours would provide the same product costs as separate departmental rates based on machine hours.
d. A plant wide rate based on direct labor hours would provide accurate product costs.
e. None of these.
12. Assuming that each of Thurow Company's products consumed all indirect resources in each department in proportion to machine hours, then which of these statements is true?
a. Departmental rates based on machine hours would provide accurate product costs.
b. A plant wide rate based on machine hours would provide accurate product costs.
c. Activity based rates would be needed to provide accurate product costs since direct labor is not used in proportion to machine hours.
d. a and b are both true.
e. None of these.
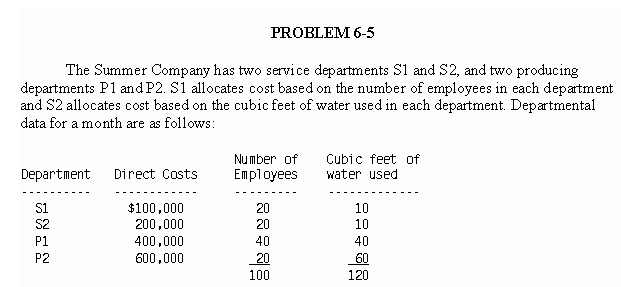
1. Using the direct method of allocating service department costs, the service department costs allocated to S1 would be
a. zero
b. (20/80)(100,000)
c. (10/110)(200,000)
d. (20/100)(S1) + (10/120)(S2)
e. none of these.
2. Using the direct method, the service department costs allocated to department P1 would be
a. (40/100)(S1) + (40/120)(S2)
b. (40/80)(S1) + (40/110)(S2)
c. (40/60)(S1) + (40/100)(S2)
d. (40/110)(S1) + (40/80)(S2)
e. none of the above.
3. Using the step-down method, the costs of
a. department S1 should be allocated first.
b. department S2 should be allocated first.
c. both departments should be allocated ignoring the reciprocal services.
d. a and c.
e. b and c.
4. Now, ignore your answer to the previous question and close department S2 first using the step-down method. The cost allocated to S1 would be
a. zero.
b. (10/120)(200,000)
c. (10/110)(200,000)
d. (10/100)(200,000)
e. (20/80)(200,000)
5. Now, ignore the two previous questions and assume that S1 is closed first using the step-down method. The costs allocated to S2 would be
a. zero.
b. (20/100)(100,000)
c. (10/120)(100,000)
d. (20/80)(100,000)
e. (10/110)(100,000)
6. Now ignore your previous answers and assume that the costs after step-down allocations to S1 and S2 are S1 = 75,000, S2 = 225,000. Then the cost of P1 after all allocations would be
a. (40/60)(75,000) + (40/100)(225,000)
b. (40/60)(100,000) + (40/100)(200,000)
c. (40/80)(75,000) + (40/100)(225,000)
e. none of these.
7. Using the reciprocal method, which equation below represents the cost of S1?
a. S1 = 100,000
b. S1 = 100,000 + (10/120)(S2)
c. S1 = 100,000 + (20/100)(S2)
d. S1 = 100,000 + (20/100)(S1) + (10/120)(S2)
e. S1 = 100,000 + (10/120)(S1) + (20/100)(S2)
d. (40/80)(100,000) + (40/100)(225,000)
8. Using the reciprocal method, which of the following equations would represent the cost of P2?
a. P2 = 600,000 + (40/100)(S1) + (40/120)(S2)
b. P2 = 600,000 + (20/100)(S1) + (60/120)(S2)
c. P2 = 600,000 + (20/60)(S1) + (60/110)(S2)
d. P2 = 600,000 + (20/80)(S1) + (60/110)(S2)
e. none of these.
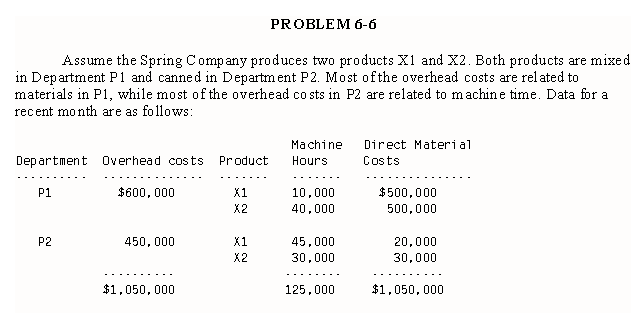
1. If Spring Company uses a plant wide rate based on machine hours, the total overhead allocations would be
a. 390,000 to X1 and 660,000 to X2
b. 520,000 to X1 and 530,000 to X2
c. 480,000 to X1 and 570,000 to X2
d. 462,000 to X1 and 588,000 to X2
e. 570,000 to X1 and 480,000 to X2
2. If the Spring Company uses a plant wide rate based on direct material costs, the total overhead cost allocations would be
a. 390,000 to X1 and 660,000 to X2
b. 520,000 to X1 and 530,000 to X2
c. 480,000 to X1 and 570,000 to X2
d. 462,000 to X1 and 588,000 to X2
e. 570,000 to X1 and 480,000 to X2
3. If the company uses departmental rates based on machine hours, the total overhead cost allocations would be
a. 390,000 to X1 and 660,000 to X2
b. 520,000 to X1 and 530,000 to X2
c. 480,000 to X1 and 570,000 to X2
d. 462,000 to X1 and 588,000 to X2
e. 570,000 to X1 and 480,000 to X2
4. If the company used departmental rates based on direct material costs, then the total overhead cost allocations would be
a. 390,000 to X1 and 660,000 to X2
b. 520,000 to X1 and 530,000 to X2
c. 480,000 to X1 and 570,000 to X2
d. 462,000 to X1 and 588,000 to X2
e. 570,000 to X1 and 480,000 to X2
5. Based on the information given in the Spring Company problem and your supporting calculations, which of the allocations below would provide the more accurate product costs?
a. 390,000 to X1 and 660,000 to X2
b. 520,000 to X1 and 530,000 to X2
c. 480,000 to X1 and 570,000 to X2
d. 462,000 to X1 and 588,000 to X2
e. 570,000 to X1 and 480,000 to X2
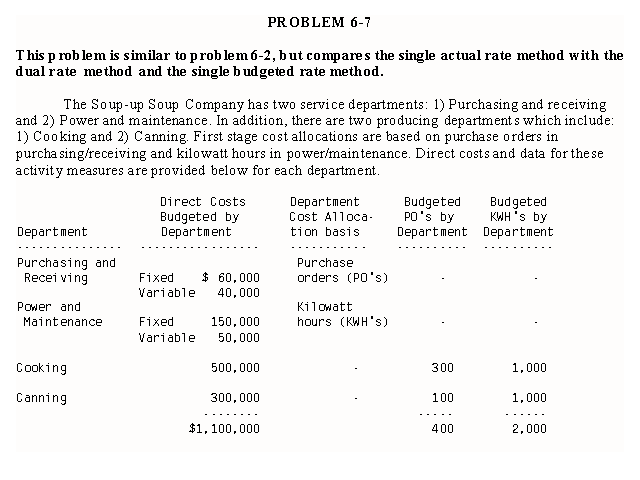
Now assume that the actual number of purchase orders completed during the period was 290 for the Cooking Department and 100 for the Canning Department. Also assume that actual costs for purchasing and receiving are $60,000 fixed costs and $39,000 variable costs.
Required:
Use the direct method and make the following calculations for the Purchasing and Receiving cost allocations to the Cooking and Canning Departments.
1. Allocate the budgeted costs using either a single or dual rate method.
2. Allocate the actual costs using a single rate based on the actual costs.
3. Allocate the actual costs using the dual rate method.
4. Allocate the actual costs using the single budgeted rate method.
5. Explain the cost distortions that occur in 2 and 3.
PROBLEM 6-8
COMPUTER PROGRAM NEEDED
COST ALLOCATIONS FOR RECIPROCAL SERVICES AND MAKE OR BUY DECISIONS
The General Products Company is a manufacturing firm with six service departments and five producing departments. Many of the service departments serve each other in addition to providing service to the producing departments. The various departments and applicable variable direct cost, (i.e., the cost identified with these departments before reciprocal service cost allocations) are presented in Table 1 for the most recent accounting period. The service departments and allocation proportions for the direct variable costs appear in the lower part of Table 1. These proportions were based on current usage. In addition to allocating costs for inventory purposes, management needs accurate cost allocations for a make or buy decision. The company has always generated its' own electric power since the plant was built in a rather isolated area of the northwest. However, a new public utility has recently offered to provide electric power to the plant for 4.5 cents per kilowatt hour. As a result the firm's management needs to know how much cost could be avoided if the electric power plant were closed, and how much electricity would be needed if it were purchased externally. The company used three million kilowatt hours of electricity during the previous period.
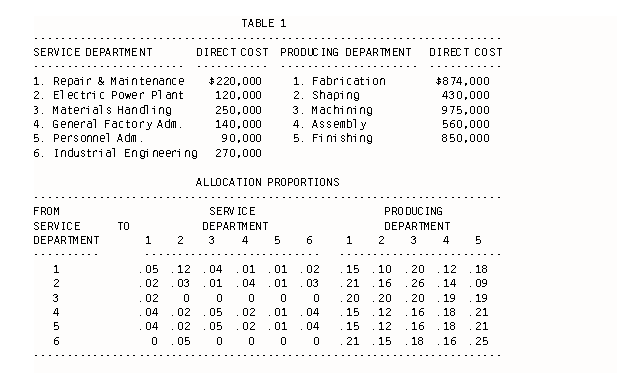
PROBLEM REQUIREMENTS
1. Allocate the service department costs to both service departments and producing departments based on the allocation proportions provided in Table 1. Show the allocations from each service department to each service and producing department, including self-service and the costs after all allocations have been made.
2. Determine the variable costs that would be avoided if the electric power plant were closed (assume fixed costs would not change) and the quantity of electricity that would be needed if electric power were purchased externally.
3. Determine the difference in the total operating cost if electricity were purchased externally and indicate whether the company should make or buy electricity.