Summary by James R. Martin, Ph.D., CMA
Professor Emeritus, University of South Florida
Data Mining and Big Data
Main | Technology Related Main
The purpose of this paper is to introduce basic data analysis concepts, to provide an eight step process for applying those concepts to accounting and auditing, and to briefly describe some of the available analytic methods and tools.
The Steps in the Process
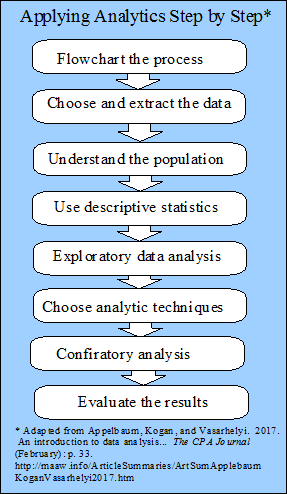
The eight steps in the process of applying analytics are illustrated in the following graphic.

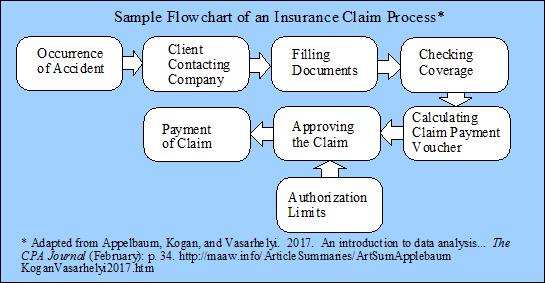
1. The first step involves flow charting the elements of the application (e.g., an insurance claim) to gain an understanding of the problem to be addressed. There are many software tools available to aid in completing this step, e.g., Tableau Public, QlickSense, RapidMiner, and Microsoft Excel or PowerPoint). A flowchart for an insurance claim process is provided as an example.

2. The second step is to choose the data fields to be extracted and examined. There are a number of auditing apps available to help facilitate this step, e.g., ACL and CaseWare provide scripts for various data formats as well as software for extracting the data from traditional systems, as well as ERP systems.
3. Step three is to develop an understanding of the population to be tested, including its nature, distribution and limitations.
4. Step four involves examining the characteristics and statistical parameters of the fields involved, e.g., maximum, minimum, medium, and variance.
5. The fifth step includes using visualization tools to explore the data to determine where to focus the data analytic methods, e.g. the riskiest areas of an audit.
6. Step six includes choosing the analytic methods that are appropriate for the data to be examined. A variety of examples are provided in the authors' Exhibit 3. I listed most of these analytic methods and tools below with a short definition and link to Wikipedia and other sites for additional information.
Data analysis - "A process of inspecting, cleansing, transforming, and modeling data with the goal of discovering useful information." Data_analysis
Descriptive Statistics - "Are summary statistics that quantitatively describe or summarize features of a collection of information." Descriptive_statistics
EDA Visualization or Exploratory Data Analysis - "An approach to analyzing data sets to summarize their main characteristics, often with visual methods." Exploratory_data_analysis
Logit/Probit - "A logit model is a regression model where the dependent variable is categorical..." e.g., pass/fail, win/lose, alive/dead. Logistic_regression
"A probit model is a type of regression where the dependent variable can take only two values." https://en.wikipedia.org/wiki/Probit
Factor Analysis - "A statistical method used to describe variability among observed, correlated variables, in terms of a potentially lower number of unobserved variables called factors." Factor_analysis
Clustering - "The formation of clusters of linked nodes in a network, measured by the clustering coefficient in statistics and data mining." Clustering
Machine Learning - "A field of computer science that gives computers the ability to learn without being explicitly programmed." Machine_learning
ANN Deep Learning - Artificial neural networks ... are computing systems inspired by the biological neural networks that constitute animal brains. Such systems learn (progressively improve performance) to do tasks by considering examples, generally without task-specific programming." Artificial_neural_network
Predictive Analytics - "...A variety of statistical techniques from predictive modeling, machine learning, and data mining that analyze current and historical facts to make predictions about future or otherwise unknown events." Predictive_analytics
Text Mining - "The process of deriving high-quality information from text... typically derived through the devising of patterns and trends through means such as statistical pattern learning." Text_mining
Issues in Big Data - Big data refers to "data sets that are so voluminous and complex that traditional data processing application software are inadequate to deal with them... Challenges include capturing data, data storage, data analysis, search, sharing, transfer visualization, querying, updating and information privacy. Big_data
Process Mining - "Is a process management technique that allows for the analysis of business processes based on event logs. Process_mining
Expert Systems - "An expert system is a computer system that emulates the decision-making ability of a human expert. Expert_system
Blockchain/Smart Contracts - "A blockchain is a continuously growing list of records, called blocks, which are linked and secured using cryptography." Blockchain "A smart contract is a computer protocol intended to facilitate, verify, or enforce the negotiation or performance of a contract." Smart_contract
XBRL eXtensible Business Reporting Language - "A freely available and global standard for exchanging business information. XBRL
Continuity Equations - "A continuity equation in physics is an equation that describes the transport of some quantity." Continuity_equation
Deep Learning - "Also known as deep structured learning or hierarchical learning is part of a broader family of machine learning methods based on learning data representations, as opposed to task-specific algorithms." Deep_learning
Python - "A widely used high-level programming language for general purpose programming." Python
R - Open source programming language widely used by statisticians and data miners for developing software and data analysis. R_(programming_language)
ACL or Audit Command Language - "ACL Analytics is a data extraction and analysis software used for fraud detection and prevention, and risk management." ACL_(software_company)
IDEA or Interactive Data Extraction and Analysis - "We focus and emphasize on interactivity and effective integration of techniques from data mining, visualization and human-computer interaction (HCI)." dea2017
SAS or Statistical Analysis System - "SAS is a software suite developed by SAS Institute for advanced analytics, multivariate analyses, business intelligence, data management, and predictive analytics." SAS
SPSS or Statistical Package for Social Sciences - "SPSS is a software package used for logical batched and non-batched statistical analysis." SPSS
Tableau - Tableau software is an interactive data visualization product focused on business intelligence. Tableau_Software
Weka - "Weka is a suite of machine learning software written in Java, developed at the University of Waikato, New Zealand."... It "contains a collection of visualization tools and algorithms for data analysis and predictive modeling, together with graphical user interfaces for easy access to these functions." Weka_(machine_learning)
7. In step seven, the analytic methods chosen are used to evaluate the data.
8. The last step is to evaluate the results obtained from the analytics methods used. For example, using an audit by exception approach, the auditor would apply a more detailed analysis of the exceptions, or outliers in the data. Although sampling may still be useful in some cases, examining the entire data set is now feasible with automated software.
Emerging Approaches
Emerging analytics approaches include predictive analytics, deep learning, Blockchain/Smart contracts, and text mining. Predictive analytic models can be used to reduce the time required for disaggregated testing of aggregated accounting data. Deep learning involves the use of artificial intelligence, neural networks and cognitive computing to develop protocols based on past experience. Smart contracts supported by blockchain technology may be automatically executed, e.g., to flag outliers etc. Text mining is another tool that is being used to mine information from PDF documents.
Tools and Information Sources
There are many sources of free educational materials and free software available to support data analysis. Free open source R software and Weka are being used in many university courses. Audit Command Language (ACL) and Interactive Data Extraction and Analysis (IDEA), Statistical Analysis System (SAS), and Statistical Package for Social Sciences (SPSS) are frequently used by large firms.
A Growing Phenomenon
Data analytics and big data are becoming more important as new technology is adopted by businesses. The message is clear. Accountants and auditors need to catch on to these techniques to stay current and competitive.
_____________________________________________________
Related summaries:
Appelbaum, D., A. Kogan, M. Vasarhelyi and Z. Yan. 2017. Impact of business analytics and enterprise systems on managerial accounting. International Journal of Accounting Information Systems (25): 29-44. (Summary).
Davenport, T. H. 1998. Putting the enterprise into the enterprise system. Harvard Business Review (July-August): 121-131. (Summary).
Gregg, A. 2017. Start-ups embrace cryptocurrency to raise needed capital: 'Initial coin offerings' let companies raise money without ceding control. The Washington Post (December 4): A13. (Note).
Martin, J. R. Not dated. What is data mining? Management And Accounting Web. Data Mining
Roberts-Witt, S. L. 2002. Data mining: What lies beneath? Finding patterns in customer behavior can deliver profitable insights into your business. PC Magazine (November, 19): iBiz 1-6. (Summary).
Tschakert, N., J. Kokina, S. Kozlowski and M. Vasarhelyi. 2017. How business schools can integrate data analytics into the accounting curriculum. The CPA Journal (September): 10-12. (Summary).
Williams, S. 2011. 5 Barriers to BI success and how to overcome them. Strategic Finance (July): 26-33. (Note).