Summary by James R. Martin, Ph.D., CMA
Professor Emeritus, University of South Florida
Learning Maps and Games Main
Page | Education Issues Main
Page
The purpose of this article is to provide a typology for thinking about the discipline of visual communication as a whole. The answers to two simple questions are needed for developing successful visualizations.
Start by asking:
1. Is the information to be presented conceptual or data-driven?
2. Does the visualization declare something, or explore something?
The answers to these questions help to indicate the tools and type of visualization needed for an effective presentation.
If the information is conceptual, the focus is on ideas and the goal is to teach. If the information is data-driven, the focus is on statistics and the goal is to inform and enlighten. If the visualization is declarative, the focus is on documenting or designing, and the goal is to affirm. If the information is exploratory, the focus is on prototyping, iterating, interacting, or automating, and the goal is to confirm or discover. In other words, is the purpose to communicate information (declarative), or figure something out (exploratory)?
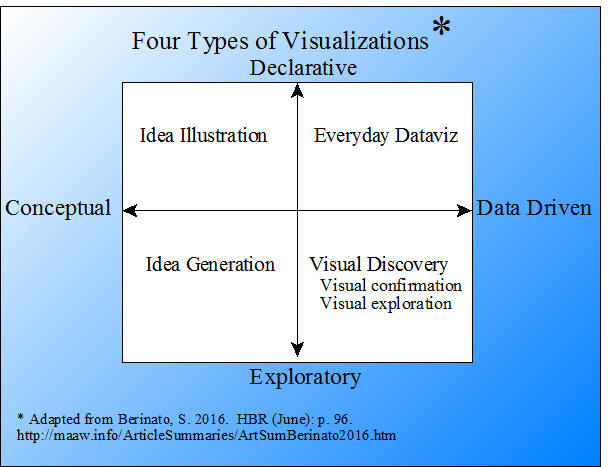
The combinations of nature and purpose questions provide four types of visual communication.
1. Idea illustration: Conceptual and Declarative
Information type - Process framework
Typical setting - Presentations, teaching
Primary skills - Design, editing
Goals - Learning, simplifying, explaining
Idea illustration relies on conceptual metaphors and includes a variety of graphics such as process diagrams, cycle diagrams, organization charts, and decision trees. Idea illustrations should be clear and simple where the focus is on structure and logic. Design and editing skills are important.
2. Idea generation: Conceptual and Exploratory
Information type - Complex undefined
Typical setting - Working session, Brainstorming
Primary skills - Team building, facilitation
Goals - Problem solving, discovery, innovation
Idea generation also relies on conceptual metaphors, but takes place in brainstorming and strategy sessions. Rapid sketches on a white board provide an example. Later these visuals can be converted into more formal idea illustrations.
3. Visual discovery: Data Driven and Exploratory
Information type - Big data, complex, dynamic
Typical setting - Working sessions, testing analysis
Primary skills - Business intelligence, programming, paired analysis
Goals - Trend spotting, sense making, deep analysis
Visual discovery includes two categories as indicated in the graphic above, visual confirmation, and visual exploration.
Visual confirmation involves answering questions such as, Is what we suspect actually true? or What are some different ways of presenting this idea? Skills related to manipulating spreadsheets, programming and paired analysis are useful for this type of visual.
Visual exploration involves open-ended data where you don't know what you are looking for, for example where a large amount of data in a spreadsheet doesn't reveal trends and relationships until it's plotted on a graph. Useful skills include those of data scientist such as analytical programming, data management, and business intelligence.
4. Everyday dataviz: Data Driven and Declarative
Information type - Simple low volume
Typical setting - formal presentations
Primary skills - Design, storytelling
Goals - Affirming setting context
Everyday dataviz or data-based visualizations are typically simple illustrations such as line charts, bar charts, pie charts, and scatter plots. Simplicity is the key where a single message speaks for itself.
Designing a visualization is a process. The typology described in this article is designed to provide a broader understanding of this process to help promote more effective visualizations. A good visualization shows some truth and moves people to feel it, to see what they couldn't see before, to change minds, to cause action, and to learn.
__________________________________________
1 This article is an adaptation from Berinato's book. Berinato, S. 2016. Good Charts: The HBR Guide to Making Smarter More Persuasive Data Visualizations. Harvard Business Review Press.
Related summary:
Martin, J. R. Not dated. Learning maps, diagrams, and flowcharts. A sampling of visualizations from MAAW. LearningMapsandFlowCharts.htm
