Chapter 3 Part II Class Problem 2
James R. Martin, Ph.D., CMA
Professor Emeritus, University of South Florida
Chapter 3 Part II |
MAAW's Textbook Table of Contents
A Call Center randomly selects five calls per hour and records how long it takes the switchboard operators to answer.1 The table below shows the sample mean times and ranges for a ten hour shift.
| Time To Answer Calls in Seconds | ||
| Sample | Mean | Range |
| 1 | 20 | 23 |
| 2 | 34 | 39 |
| 3 | 45 | 14 |
| 4 | 39 | 5 |
| 5 | 26 | 20 |
| 6 | 29 | 17 |
| 7 | 13 | 21 |
| 8 | 34 | 11 |
| 9 | 37 | 40 |
| 10 | 23 | 10 |
| 300 | 200 | |
Required:
1. Determine the upper and lower limits for an X-bar chart.
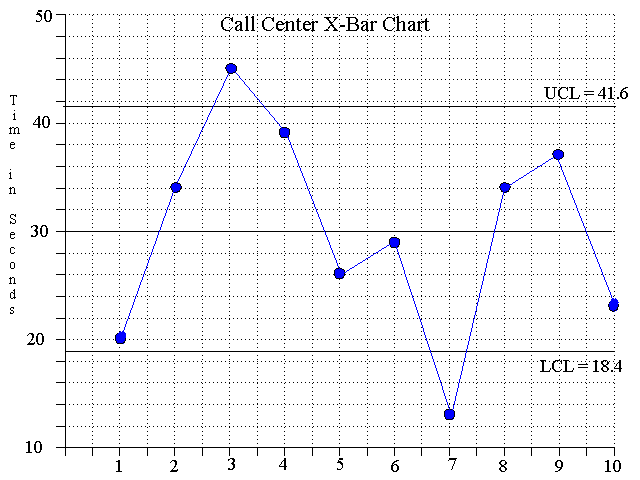
2. Construct an X-bar chart.
3. Determine the upper and lower limits for a range chart.
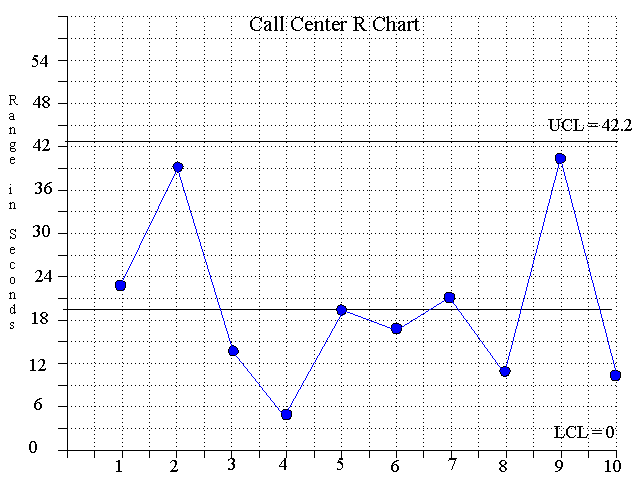
4. Construct a range chart.
5. Does the process appear to be in control? Explain.
6. What do you think the company should do in response to these results?
The Blank Graphs are useful for constructing the charts by hand.
Solution
1. The grand mean and mean of the ranges are calculated as follows:
=
X = 300 ÷ 10 = 30
_
R = 200 ÷ 10 = 20
Control limits for the X-bar chart are calculated as follows based on the sample size of 5 observations (See Exhibit 3-9):
=
_
X + A2R = 30 + (.577)(20) = 41.54 = upper control limit.
=
_
X - A2R = 30 - (.577)(20) = 18.46 = lower control limit.
2. An X-bar chart for the Call Center appears below.

3. Control limits for the R-chart are determined in the following manner based on the sample size of 5 observations (See Exhibit 3-9).
_
D4R = (2.115)(20) = 42.3 = upper
control limit.
_
D3R = (0)(20) = 0 = lower
control limit.
4. The Call Center range chart is illustrated below.

5. The process does not appear to be in control since two points on the X-bar chart are outside the limits.
6. Although we do not have much data to make a decision, the process might need to be investigated in response to these results? The volume of calls at certain times may be the problem so that the process is not operating under constant conditions at all times. A different number of operators and a different chart may be needed to monitor performance during peak periods.
__________________________
1 This problem was adapted from an illustration on page 549 in Boot, J. C. G. and E. B. Cox. 1970. Statistical Analysis for Managerial Decisions. McGraw-Hill.