Chapter 5
Normal Historical Full Absorption Process Costing
James R. Martin, Ph.D., CMA
Professor Emeritus, University of South Florida
MAAW's Textbook Table of Contents
After you have read and studied this chapter, you should be able to:
1. Explain the difference between process cost accumulation and job order cost accumulation.
2. Describe the various categories of units in a process cost system and how they are related.
3. Define and use the concept of an equivalent unit.
4. Solve process cost problems when there is no beginning inventory of work in process.
5. Explain the conceptual difference between the weighted average and first-in, first out cost flow assumptions.
6. Solve process cost problems when the weighted average cost flow assumption is chosen.
7. Solve process cost problems when the first-in, first out cost flow assumption is chosen.
8. Solve process cost problems that include normal spoilage, or lost units.
9. Solve process cost problems that include abnormal spoilage, or lost units.
10. Discuss normal historical, full absorption, process costing in terms of the four functions of an information system outlined in Chapter 2.
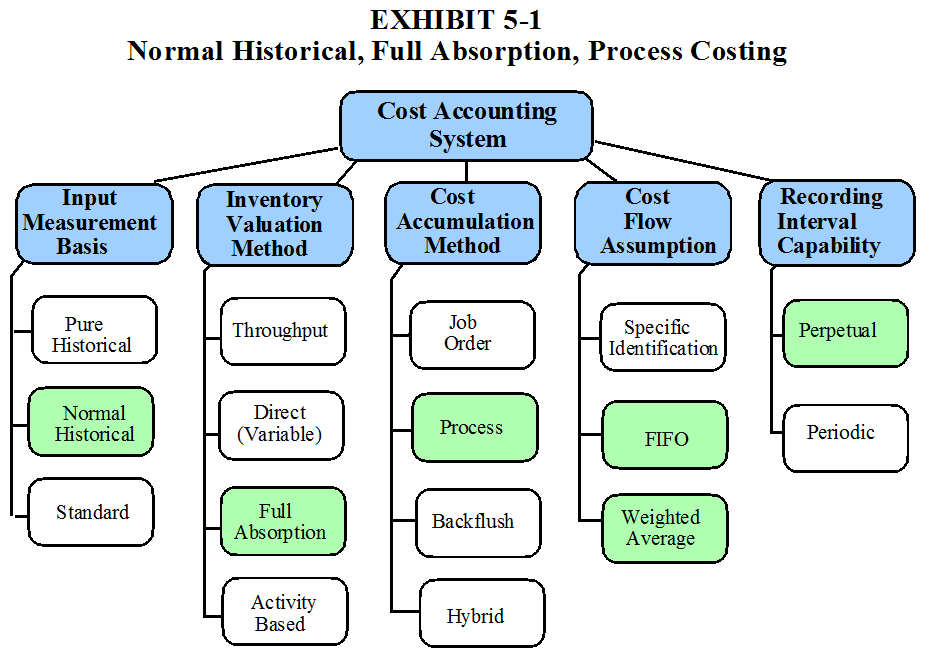
This chapter is similar to Chapter 4 in that it moves from the abstract concepts described in Chapter 2 towards an operational cost accounting system. The main focus of this chapter is the manner in which costs flow through the perpetual inventory accounts in normal historical, full absorption, process costing. These sub-components and the two cost flow assumptions that are applicable to process costing are highlighted in Exhibit 5-1. More specifically, the chapter combines normal historical, full absorption costing with process cost accumulation and the weighted average and first-in, first-out (FIFO) cost flow assumptions.
The chapter includes six sections. The first section introduces the concepts and terminology associated with the process cost accumulation method. This section illustrates the general cost flow in a process cost system, the various categories of units involved and the concept of an equivalent unit. The second section introduces the techniques associated with process costing when there are no spoiled or lost units involved. This section includes: 1) a solution algorithm for situations when there is no beginning inventory, 2) a solution algorithm for situations when there is a beginning inventory and the weighted average cost flow assumption is used and 3) a solution algorithm for situations when there is a beginning inventory and the FIFO cost flow assumption is used. This section also includes a discussion of the conceptual differences between the accounting treatments under the two cost flow assumptions and a decision flow chart to help you visualize these differences. The third section provides an example where both the weighted average and FIFO cost flow assumptions are used. Section four extends the solution algorithms to include spoiled and lost units and section five provides an example to illustrate the techniques. The last section provides a short discussion of normal historical, full absorption, process costing in relation to the four functions of an information system outlined in Chapter 2.

CONCEPTS AND TERMINOLOGY IN PROCESS COSTING
As described in Chapter 2, process costing means that costs are accumulated by departments, operations, or processes. The method is applicable where a continuous mass production or assembly operation is involved and the work performed on each unit is standardized or uniform. This type of system is different from job order cost accumulation in terms of: 1) the manner in which the cost flow through the accounts, 2) the terminology and concepts involved, and 3) how costs are assigned to the units produced. Each of these aspects of process costing is discussed below.
GENERAL COST FLOW IN PROCESS COSTING
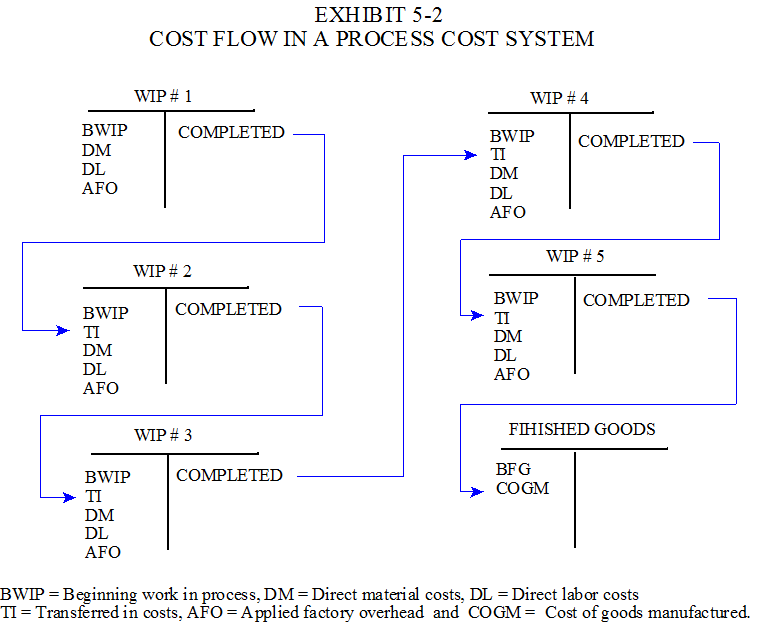
The work in process accounts associated with a simplified process cost system are illustrated in Exhibit 5-2. Although a process cost system can include any number of processes, this illustration assumes that there are five departments or operations. In this type of system, direct materials, direct labor, and factory overhead are charged to work in process in the same manner illustrated in the previous chapter. For this reason, the accounts for materials, payroll and factory overhead are omitted from the exhibit to simplify the illustration and avoid unnecessary redundancy. However, notice that there are several work in process accounts involved rather than a single account. The general idea is that the costs of the completed units in Process #1 are transferred to Process #2 along with the completed units. Each subsequent process performs an additional operation on the products before transferring the units and costs to the next department. Note also that this transfer of units and costs from process to process creates a new cost category in the WIP accounts. This new category is referred to as transferred-in costs (TI in Exhibit 5-2).
PROCESS COSTING TERMINOLOGY AND CONCEPTS
All of the costs that are charged to the WIP accounts must be assigned or allocated to the units produced in the various departments or processes. The techniques designed to accomplish this cost assignment depend on six categories of units.
Six Categories of Units in Work in Process
The various categories of units applicable in a process cost accumulation system are defined below.
1) Units in the Beginning Inventory. These are units that were started during the previous month and finished during the current month. These units are designated as BWIP, i.e., beginning work in process.
2) Units started, or transferred-in, during the month. The sum of categories 1 and 2 provides the total number of units to be accounted for at the end of the month.
3) Units started during the current month and finished during the current month. Some of the units started during the month will be completed at the end of the month and some will be partially complete.
4) Units completed. This group normally includes the units in categories 1 and 3. The units that are in the beginning work in process are normally finished during the month, as well as some of the units that are started during the month. Usually units completed and units transferred are the same, but there are exceptions, e.g., where the next process has limited space. Any completed units that are spoiled are not included in this category.
5) Units in the ending inventory. These are units started during the current month, but not finished. This group of units is referred to as EWIP, i.e., ending work in process.
6) Spoiled or lost units. These units do not meet product specifications, or in the case of lost units, simply cannot be found. Lost units are fairly common for companies that produce liquid products such as beverages, cleansers, lubricants and a host of other products.
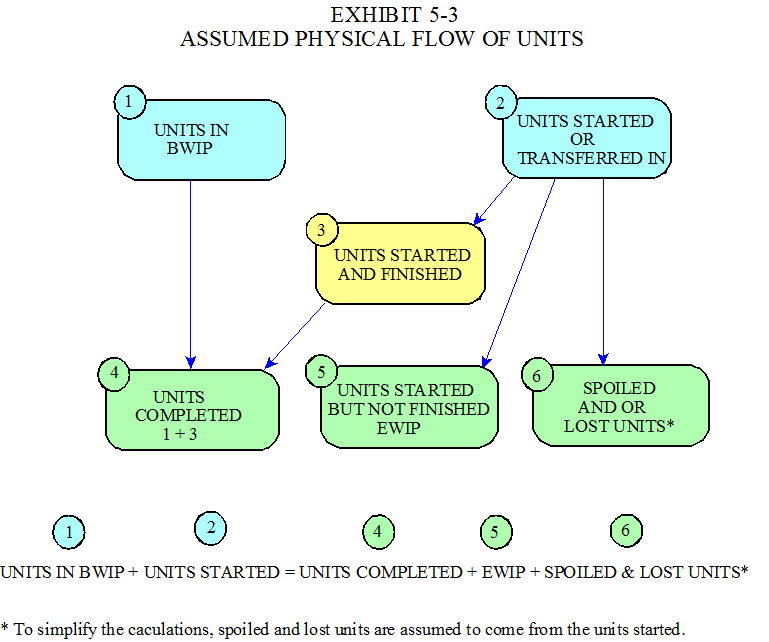
The connections between the various categories of units are illustrated in Exhibit 5-3.The following equation summarizes the key relationships.
(1) BWIP + (2) UNITS STARTED = (4) UNITS COMPLETED + (5) WIP + (6) SPOILED and LOST UNITS
This equation is important because it is frequently needed to find an unknown such as the number of units spoiled or lost. The left hand side of the equation represents the number of units to be accounted for, while the right hand side shows the three categories of units that usually exist at the end of a period. Category 4 includes categories 1 and 3. You can see this in Exhibit 5-3. Also notice from the exhibit that any spoiled and lost units are assumed to come from the units started.1 The task to be performed in every process cost system, is to allocate the costs accumulated in the work in process account to the groups of units on the right-hand side of this equation. To keep the initial illustrations relatively simple, we will ignore the possibility of spoiled or lost units until later in the chapter.
Each problem involves calculating a unit cost, i.e., average cost per unit, and then using this unit cost to assign the cost to be accounted for to the units completed and the units in the ending inventory of work in process, i.e., categories 4 and 5. Normally there are some fully completed units and some partially completed units, i.e., those in the ending inventory. To calculate a cost per unit we must state all units in terms of a common denominator. This common denominator is referred to as an equivalent whole unit, or equivalent unit for short. For example, 100 units ½ complete represents 50 equivalent units. The stage of completion for the beginning and ending inventories is used to calculate the equivalent units for those categories. The stage of completion for a group of units is based on an estimate of the average level of completion for all the units in the group.
PROCESS COST TECHNIQUES EXCLUDING SPOILAGE AND LOST UNITS
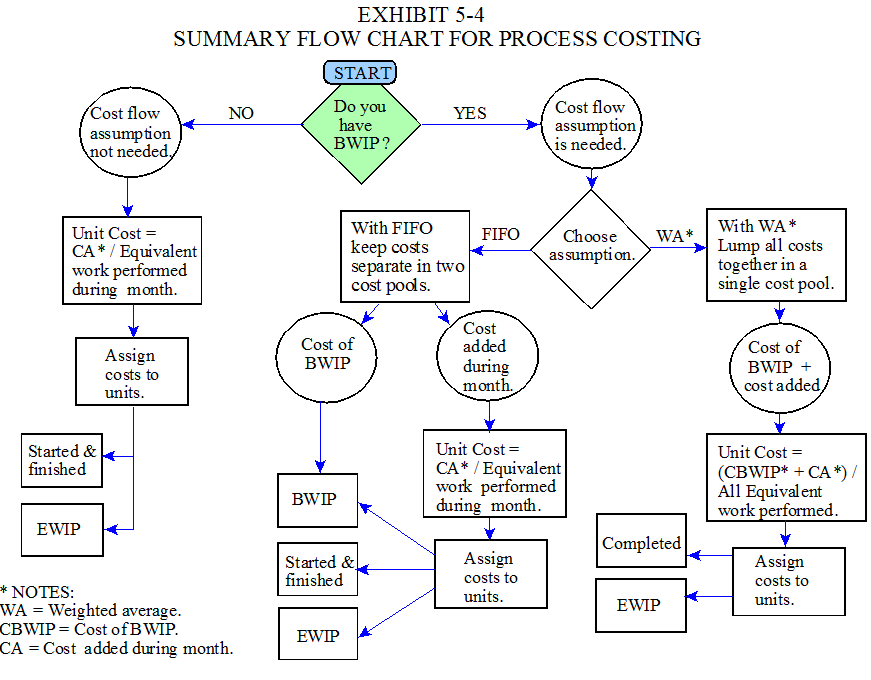
Three types of situations are discussed in this section. These include: 1) cases where a beginning inventory is not involved, 2) cases that include a beginning inventory and the weighted average cost flow assumption is chosen and 3) cases that include a beginning inventory and the FIFO cost flow assumption is chosen. These three cases are discussed individually below. A summary of the entire section appears in Exhibit 5-4.
ALGORITHM USED WHEN THERE IS NO BEGINNING INVENTORY
The following two step approach is applicable when there is no beginning inventory of work in process. The numbered equations are referred to in the examples illustrated in subsequent sections of this chapter. NB indicates that (N)o (B)eginning inventory is involved.
Step I. Calculate The Unit Cost NB
[1 NB] Unit Cost = Costs Added during the month ÷ (Units Completed + Equivalent units in EWIP)
Usually, at least two unit cost calculations are required, one for direct materials and one for conversion, i.e., labor and overhead. This is because the stage of completion of the units in the ending inventory is usually different for materials and conversion. The idea is that conversion work is preformed more or less continuously, while materials are added at a specific point in the process, e.g., at the beginning of the process or at the end of the process.
Step II. Account For The Cost NB
[2 NB] Cost of Units Completed and Transferred = (Unit Cost)(Units Completed)
[3 NB] Cost of EWIP = (Unit cost)(Equivalent units in EWIP)
As indicated by these equations, the second step involves determining how much cost to assign to the two categories of units, i.e., the completed units that are transferred to the next department, or to finished goods, and the units that remain in the ending inventory. A cost flow assumption is not needed when there is no beginning inventory. A conceptual view of this algorithm is presented on the left-hand side of Exhibit 5-4.
METHODS OF ACCOUNTING FOR BWIP
When there is a beginning inventory of work in process, a cost flow assumption is required. The two assumptions commonly used are weighted average (WA) and first-in, first-out (FIFO).
Algorithm for the Weighted Average Cost Flow Assumption
This algorithm does not keep the units in the beginning inventory separate from the units started during the period. They are lumped together in a single cost pool as indicated in step I below.
Step I. Calculate The Unit Cost WA
[1 WA] Unit Cost Weighted average = (Cost of BWIP + Cost added during the month) ÷ (Units Completed + Equivalent units in EWIP)
Step II. Account For The Cost WA
[2 WA] Cost of Units Completed and Transferred = (Unit Cost)(Units Completed)
[3 WA] Cost of EWIP = (Unit Cost)(Equivalent Units in EWIP)
A conceptual view of this algorithm appears on the right-hand side of the flow chart in Exhibit 5-4. The completed units include the units that were in the beginning inventory, as well as the units started and finished during the month.
Algorithm for the First-in, First-out Cost Flow Assumption
The previous month’s ending inventory becomes the current month’s beginning inventory. When FIFO is used, the costs that were charged to the current month’s beginning inventory at the end of the previous month are kept separate from the costs added during the current month. This means that there are two cost pools when FIFO is used. One cost pool is for the cost that were assigned to the ending inventory from the previous period. As noted above, the previous period’s ending inventory becomes the current period’s beginning inventory. These costs are not lumped together with the current period costs as in the weighted average method. The unit cost calculation is based on the second cost pool that represents only cost added during the current month. The denominator in the calculation represents the work performed during the current month.
Step I. Calculate The Unit Cost FIFO
[1 FIFO] Unit Cost FIFO = Cost Added during the month ÷ Work performed during the month stated in Equivalent Units
= Cost Added during the month ÷ (Equivalent work on Completed Units during month + Equivalent work on EWIP units)
= Cost Added during the month ÷ (Units Completed - Equivalent Units in BWIP + Equivalent Units in EWIP)
The first form of Equation [1 FIFO] provides a conceptual definition for unit cost when the FIFO cost flow assumption is chosen. The last form of the equation provides an operational definition that is used to calculate the unit cost. The equation is developed in stages to connect the conceptual and the operational definitions. In this calculation, the cost of the work performed during the current month is divided by the equivalent work performed during the current month stated in terms of equivalent units. The units completed includes the equivalent units in beginning work in process. Since this represents work performed during the previous month, it must be subtracted from the units completed to obtain the equivalent work performed on the completed units during the current month. In this way, the work performed during the previous month is taken out of the denominator while keeping the cost of that work out of the numerator.
An alternative calculation for the denominator in Equation [1 FIFO] is:
Units Started and Finished during the month + Equivalent Work performed on the units in BWIP during the month + Equivalent work performed on the units in EWIP during the month.
Comparing the two denominators reveals alternative ways of excluding the equivalent work performed during the previous month.
Units Completed - Equivalent Units in BWIP = Units Started and Finished during the month + Equivalent Work performed on the units in BWIP during the month.
The expression on the left-hand side of the equation above, starts with all the work performed and then removes the work performed during the previous month. The expression on the right-hand side, only includes the work performed during the month. The expression on the left-hand side tends to be more confusing, but is included in Equation [1 FIFO] because it requires less work to obtain a solution. However, study both alternatives to help strengthen your understanding of the concepts involved.
Step II. Account For The Cost FIFO
When the cost are assigned, the units in beginning work in process keep the costs that were charged to them at the end of the previous month, and are charged with additional cost for the additional work required during the current month. Then the cost assigned to the units started and finished is based on the current month’s unit cost. This approach is more accurate, although it is more involved.
[2 FIFO] Cost of Units Completed and Transferred = Cost of units in BWIP at beginning of month + (Unit cost)(1- Stage of BWIP)(Number of BWIP Units) + (Unit cost)(Units started and finished)
[3 FIFO] Cost of EWIP = (Unit Cost)(Equivalent units in EWIP)
Observe that the two groups of completed units are kept separate in Equation [2 FIFO]. The units that were in the beginning inventory keep the costs that were charged to them at the end of the previous month and are charged with additional costs based on the amount of current period work required for completion. For example, if the units were seventy percent complete at the end of the previous month, (i.e., beginning of the current month) then they would need 1 - .7 = .3 or thirty percent more work to convert them into completed units. The other completed units, i.e., the units that were started and finished during the current month are charged with a full dose of unit cost. A conceptual view of the FIFO algorithm appears in the middle of the flow chart in Exhibit 5-4. The chart provides a summary of the decisions and steps required for the three types of process cost problems.
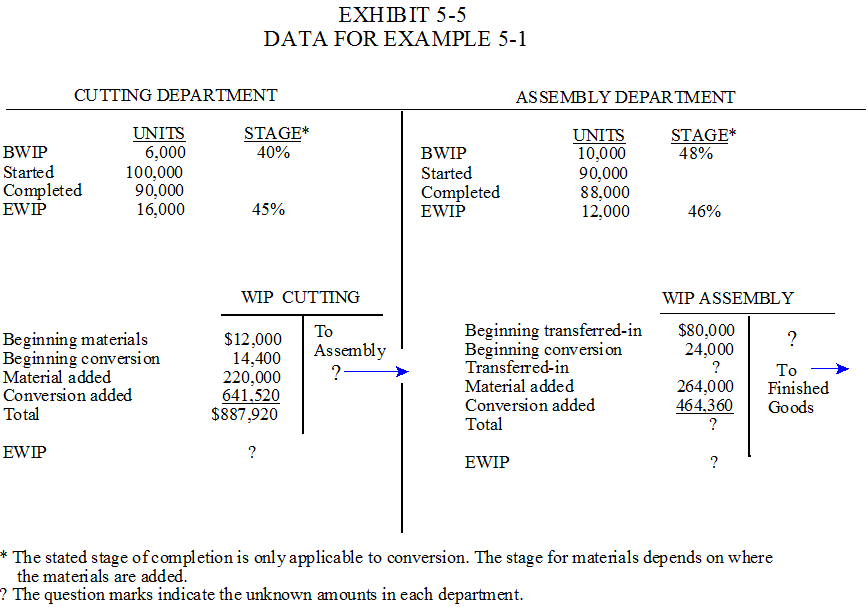
The Windsole Shoe Company produces running shoes in two processes. Canvas is placed in production at the beginning of the process in the first department where it is cut to product specifications. These materials are transferred to the second department where they are sewn and then assembled with the shoe soles at the end of the process. In the first department a unit refers to the amount of canvas required for one pair of shoes. In the second department, a unit of finished product refers to one pair of Windsole running shoes. Relevant information for a recent month is provided in Exhibit 5-5. The requirements in each department are to: 1) calculate the unit cost, and 2) assign the total costs to the two categories of units remaining at the end of the process, i.e., the units transferred out and the units in the ending inventory.
STAGE OF COMPLETION
The stage of completion that appears in Exhibit 5-5 for the beginning and ending inventories refers to the average stage applicable to the conversion work performed. As far as material is concerned, the units are either 100% complete, or 0% complete depending on where the material is placed in production. In the cutting department, the units in BWIP and EWIP are 100% complete in terms of material because the material (canvas) is added at the beginning of the process. In the assembly department, the units in BWIP and EWIP are 0% complete in terms of materials because the materials (soles) are added at the end of the process.
WEIGHTED AVERAGE SOLUTION
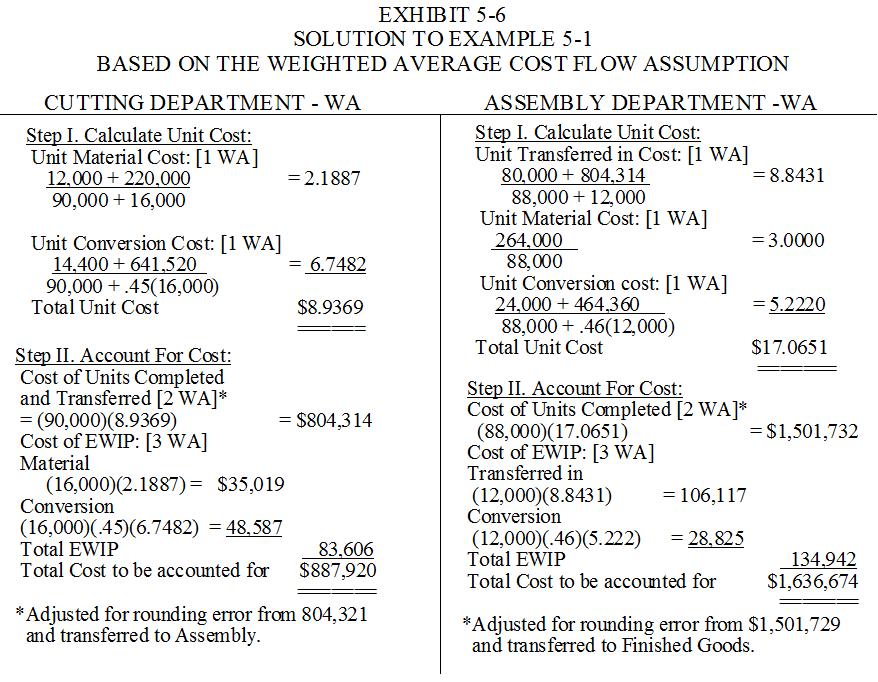
The requirements for the weighted average cost flow assumption are provided in Exhibit 5-6 for both departments. The calculations applicable to the Cutting Department appear on the left-hand side and those applicable to the Assembly Department appear on the right-hand side of the exhibit.
Cutting Department
Step I WA. Observe from Exhibit 5-6 that two unit cost calculations are required in the Cutting Department. This is because the stage of completion for the units in ending work in process is different for material and conversion. Since all material is added at the beginning of the process, the stage of completion for EWIP is 100 percent for material, although the stage for conversion is only 45%. A single unit cost calculation can be made for labor and overhead as long as overhead is applied on the basis of direct labor. Then the same stage of completion is applicable to both labor and overhead. Refer back to Equation [1 WA] to verify how the unit costs are calculated. They are carried out to four decimal places to avoid large rounding errors.
Step II WA.Accounting for the cost involves assigning an appropriate amount of cost to the two categories of units that are present at the end of the month, i.e., the completed units and units in EWIP. This is accomplished with the equations designated as [2 WA] and [3 WA] in the previous section. The order of these two calculations is not particularly important, but the total must be equal to the total cost to be accounted for, i.e., $887,920. The calculation based on Equation [2 WA] provides the amount of cost allocated to the units completed. Note from the calculations based on Equation [3 WA] that EWIP is 100 percent complete as far as material is concerned, but only 45 percent complete in terms of labor and overhead. Adding the cost of EWIP to the cost of the units completed equals $887,927. This amount exceeds the total cost to be accounted for by $7 due to rounding. When a rounding error occurs, it is convenient to adjust the largest amount so that the total will be equal to the total cost to be accounted for. Observe that the cost transferred out is reduced by $7 to adjust for the error. Therefore, $804,314 is transferred from Cutting to Assembly rather than $804,321.
Assembly Department
Step I WA.The unit cost calculations for the Assembly Department are also based on Equation [1 WA], but there are two important differences in this department. First, there is an additional category of cost referred to as transferred-in cost. These costs represent Cutting Department costs in the Assembly Department's inventory. This is logical since all the completed units (cut canvas) in Cutting are transferred to Assembly along with the cost allocated to those units. The $80,000 in the Assembly Department's beginning inventory represents Cutting Department costs that remained in the Assembly Department's inventory at the end of the previous month. The units in the ending inventory (12,000) are 100 percent complete as far as Cutting Department costs are concerned.
The second difference involves the unit material cost calculation. Since the materials (shoe soles) are added, or attached at the end of the process in Assembly, there is no Assembly Department material cost in the beginning inventory. This is because these 10,000 units (see Exhibit 5-5) did not reach the end of the process during the previous month. Therefore, the soles were attached to these units during the current month as they were completed. The same logic is used to explain why the denominator in the unit material cost calculation does not include EWIP. These 12,000 units are only 46 percent complete and will not receive the Assembly material (soles) until they reach the end of the production process next month.
Step II WA. The cost are accounted for in the usual way by determining how much cost to allocate to the two categories of units at the end of the month, i.e., units completed and units in the ending inventory. Equations [2 WA] and [3 WA] are used for this purpose just as they were in the Cutting Department calculations. However, there are some notable differences between the two departments. First, the ending inventory includes transferred-in cost. The EWIP is 100 percent complete as far as transferred-in cost is concerned because this category represents work performed in the first department. No material costs are assigned to EWIP because these 12,000 units have not reached the point where the materials (soles) are attached. Since EWIP is 46 percent complete as far as labor and overhead is concerned, .46 multiplied by the unit conversion cost of 5.222 is assigned to each of the 12,000 units. The cost of the units completed and transferred to finished goods is calculated in the usual way using Equation [2 WA]. The amount is rounded up by approximately $3 to adjust for the rounding error.
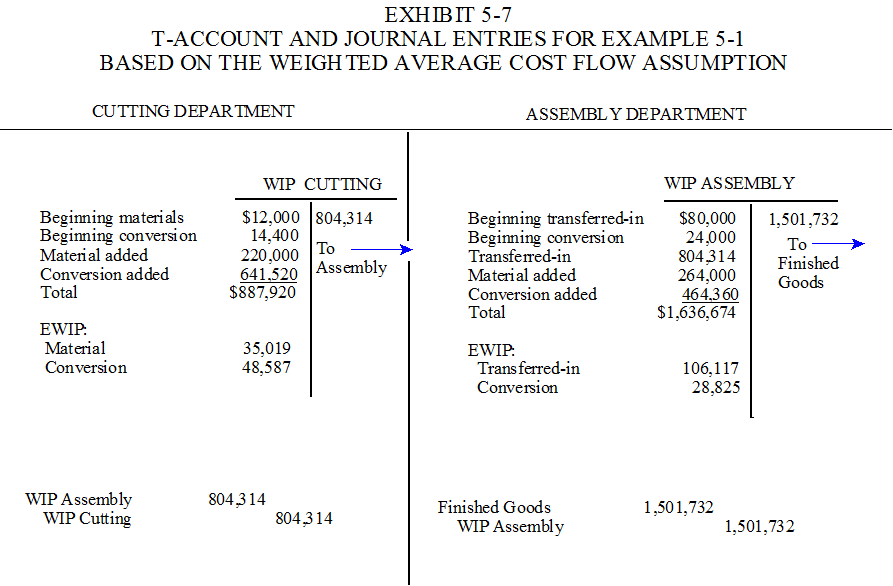
Journal Entries WA
The journal entries to record the transfers are provided in Exhibit 5-7. Remember that all the other entries to record and distribute material and labor, record other overhead costs, and apply overhead costs are essentially the same as in Chapter 4. Direct labor and factory overhead are combined in this example to simplify the illustration. The overhead variance analysis illustrated in Chapter 4 is also applicable to normal historical process costing. However, different overhead rates are frequently used in each process or department. We will consider when plant wide, departmental and activity based overhead rates are appropriate in the next two chapters.
FIRST-IN FIRST-OUT SOLUTION
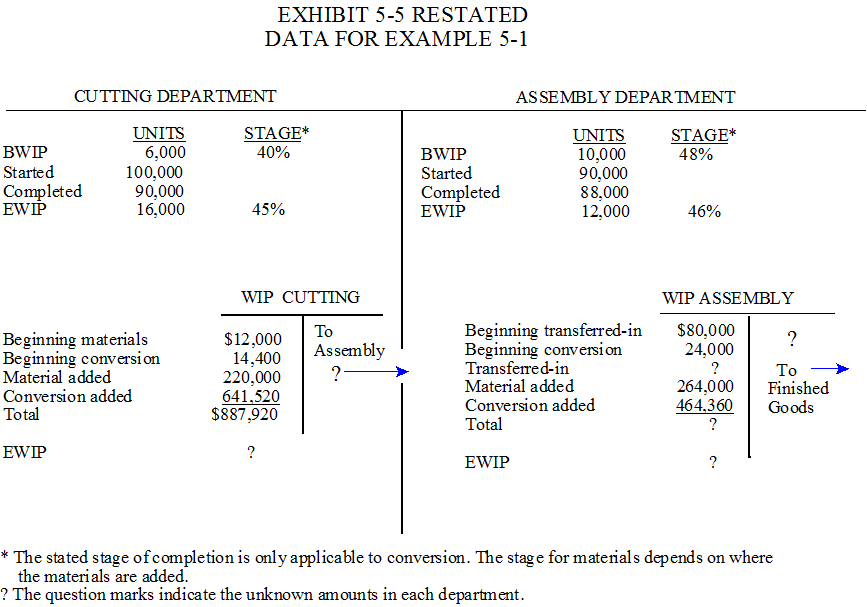
The solution to Example 5-1 based on the FIFO cost flow assumption appears in Exhibit 5-8. To make it easier to trace the calculations back to the original data, Exhibit 5-1 is restated below.
Cutting Department
Step I FIFO.The unit cost calculations in Exhibit 5-8 are based on Equation [1 FIFO]. The cost of the beginning inventory is excluded from the numerator in each calculation, and the equivalent work performed on the beginning units during the previous month is subtracted from the denominator. In the Cutting department, the 6,000 units in BWIP received material when started last month. Since the FIFO unit cost is only based on the work performed during the current month, these 6,000 units must be subtracted from the 90,000 completed units. These 6,000 units are included in the 90,000 completed units, but only the equivalent work performed during the current month belongs in the denominator. This includes the 84,000 units started and finished this month (i.e., 90,000 - 6,000) and the 16,000 units in the ending inventory. The entire 16,000 units are included in the denominator because these units received 100 percent of the required material during the current month. In fact, in the Cutting Department, the unit is the material.
The same logic is used to calculate the unit conversion cost. Since the beginning units were 40 percent complete at the end of the previous month, 2,400 equivalent units (.4 multiplied by 6,000) are subtracted to determine the amount of conversion work performed on the completed units during the current month. Although there are 90,000 completed units, only 87,600 equivalent units represent work performed during the current month (i.e., 90,000 - 2,400). The addition of 7,200 units (.45 multiplied by 16,000) to the denominator includes the equivalent conversion work that has been performed on the units that remain in the ending inventory.
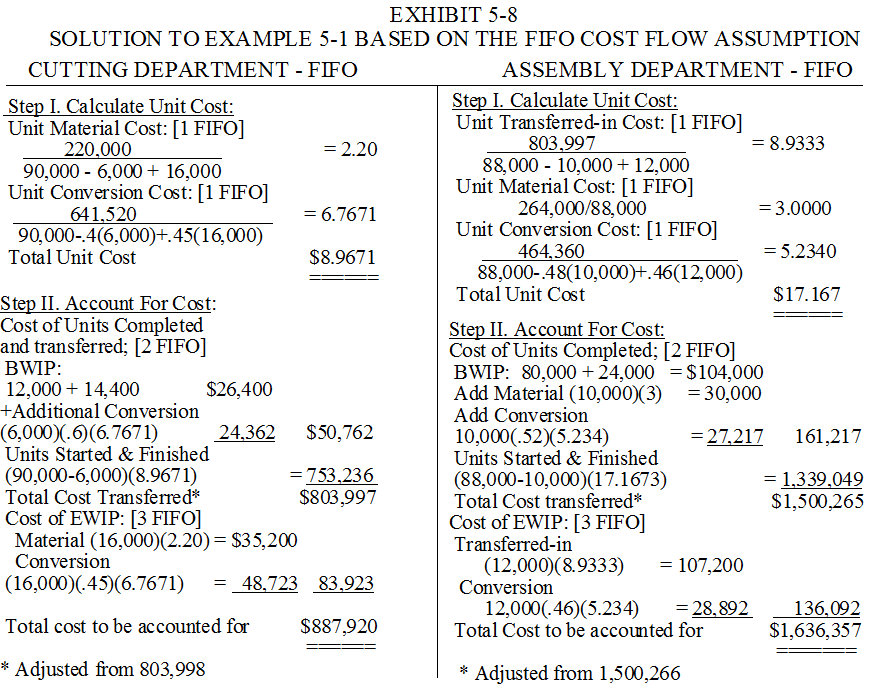
Step II FIFO. Assigning cost to the completed units is more involved when FIFO is used. We can't just multiply the completed units by the total unit cost as in the weighted average method. Remember, when FIFO is used, the two categories of completed units are kept separate. The cost of the units in the beginning inventory is calculated first in Equation [2 FIFO]. These units keep the $26,400 assigned to them at the end of the previous month and are charged with 60 percent more conversion costs to determine their completed cost. Observe that 60 percent is added, not 40 percent. Since these units received 40 percent of the required conversion work (and conversion costs) last month, an additional 60 percent was needed during the current month. The costs allocated to the rest of the completed units, i.e., the 84,000 units that were started and finished during the current month, is also calculated in Equation [2 FIFO]. Then the sum of these two calculations (i.e., 50,762 + 753,236) provides the amount to transfer to the Assembly Department before the rounding error adjustment. The cost of the ending inventory is calculated using equation [3 FIFO]. Mechanically, the EWIP calculation is just like the one used in the weighted average solution, although the unit costs are different.
Assembly Department
Step I FIFO. There are three unit cost calculations in the Assembly Department. The unit transferred-in cost represents the unit cost of the 90,000 units transferred in from the Cutting Department during the current month, i.e., $803,997 divided by 90,000 units equals 8.9333.
The denominator in the unit material cost calculation deserves a little extra attention. Remember that Assembly Department material is added at the end of the process. The 10,000 units in the beginning inventory received material (soles) during the current month as they reached the end of the process. Therefore these units are included in the denominator as part of the 88,000 completed units. The 12,000 units in the ending inventory have not reached the end of the process, therefore no Assembly Department material (soles) has been added to these units and they are logically excluded from the denominator in the unit material cost calculation.
Unit conversion costs are also calculated using Equation [1 FIFO]. The mechanics and logic of this equation are the same as those used in the Cutting Department calculation. However, trace each amount back to the original data to insure that you understand the calculation.
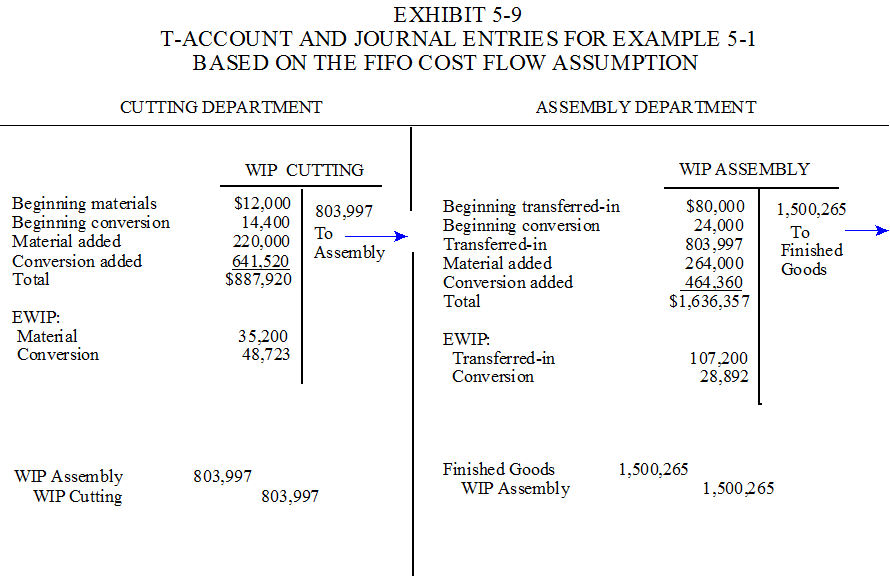
Step II FIFO. There are a few important differences in the way the cost are accounted for in the Assembly Department. The total cost of the 88,000 units transferred to Finished Goods is based on Equation [2 FIFO]. Observe, from Exhibit 5-8 that the costs are assigned to the two categories of completed units separately. The beginning inventory units keep the $104,000 assigned to them at the end of the previous month. Then, a full dose of assembly material costs ($3 each) is added since these units received this material (soles) at the end of the process as they were finished. Since 48 percent of the conversion work on these 10,000 units was performed during the previous month, these units are charged with an extra 52 percent based on the current month's unit cost. The other 78,000 completed units that were started and finished during the month (88,000 - 10,000) are each charged with $17.167, i.e., the total unit cost for the current month. The sum of these separate calculations, (i.e., 161,217 + 1,339,049) provides the amount of costs charged to finished goods before the rounding error adjustment. The cost of the ending inventory is determined using Equation [3 FIFO]. Material costs do not appear in the calculation because these 12,000 units will not receive assembly material (soles) until next month when they reach the finish line. The journal entries to record the transfers are provided in Exhibit 5-9.
THE STAGE FOR MATERIAL
The stage of completion for material is seldom mentioned in a process cost problem. However, it is normally based on the point in the production process where material is added. Obviously, some material must be placed in production at the beginning of the process in the first department, but material can be added anywhere in subsequent departments. In some departments, material is added continuously during the process. For this reason, when calculating unit material cost and assigning material costs to ending work in process, we must always think about where the material is added. If more than one type of material is added in a department, additional calculations are obviously required. Although solving problems with multiple materials placed in production at different points in the process does not involve any new concepts or techniques, generating correct solutions requires careful thinking.
COMPARING FIFO AND WEIGHTED AVERAGE
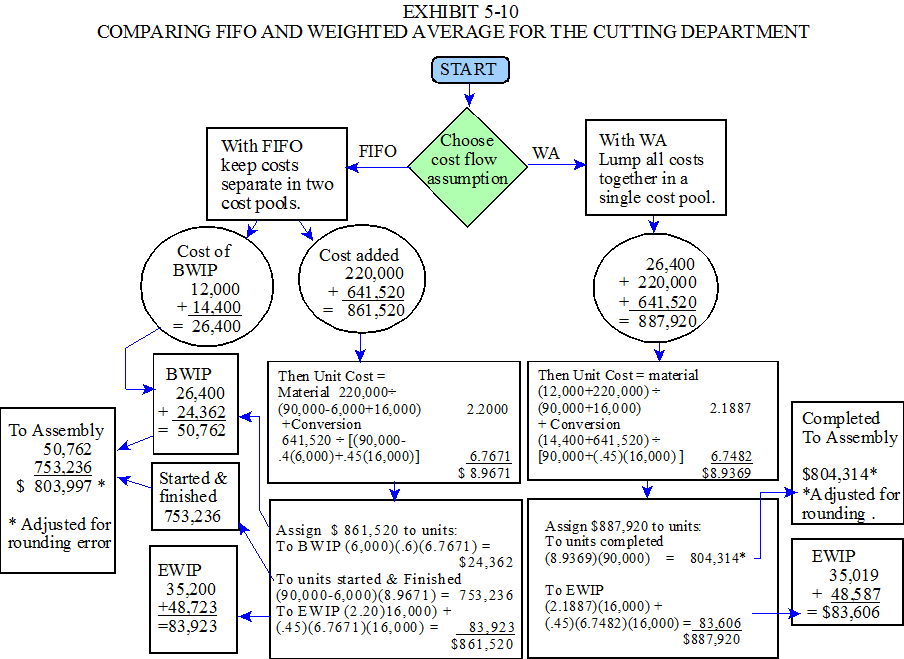
The FIFO and weighted average solutions are compared in Exhibits 5-10 and 5-11. Exhibit 5-10 provides a flow chart view of the FIFO and weighted average solutions for the Cutting Department. Exhibit 5-11 provides a similar view for the Assembly Department. These exhibits emphasize that two cost pools are maintained in the FIFO approach, while only one cost pool is used in the weighted average method.
Cutting Department Comparison
Exhibit 5-10 shows that the two cost pools for FIFO are the cost of BWIP ($26,400) and the cost added ($861,520). The single cost pool for weighted average includes both of these amounts ($887,920). The amounts that appear in the cost pools are from Exhibit 5-5. The FIFO unit costs are based on the $861,520 cost added (The calculations are the same as those in Exhibit 5-8). When assigning the Cutting Department costs to units based on FIFO, the $26,400 stays with the BWIP and the costs added ($861,520) are spread across all units based on the current month work performed, i.e., $24,362 to the BWIP and $753,236 to the units started and finished during the month.
The weighted average unit costs are based on the $887,920 single cost pool that includes the $26,400 assigned to the BWIP at the end of the previous period (These calculations are the same as those in Exhibit 5-6). Therefore, when assigning the Cutting Department costs to units based on weighted average, the entire $887,920 is spread across the units based on the work performed on the units during both periods.
Assembly Department Comparison
Exhibit 5-11 presents a similar view of the Assembly Department. Two cost pools are maintained in the FIFO method. One cost pool represents the $104,000 assigned to BWIP at the end of the previous period and the other cost pool is for the $1,532,357 added during the current period. These amounts are from Exhibit 5-5. When assigning the cost to units, the $104,000 stays with the BWIP. The FIFO unit costs are based on the second cost pool and then assigned to the units based on the work performed during the current month, i.e., $30,000 + $27,217 to BWIP and $1,339,049 to the units started and finished during the month (The calculations are from Exhibit 5-8).
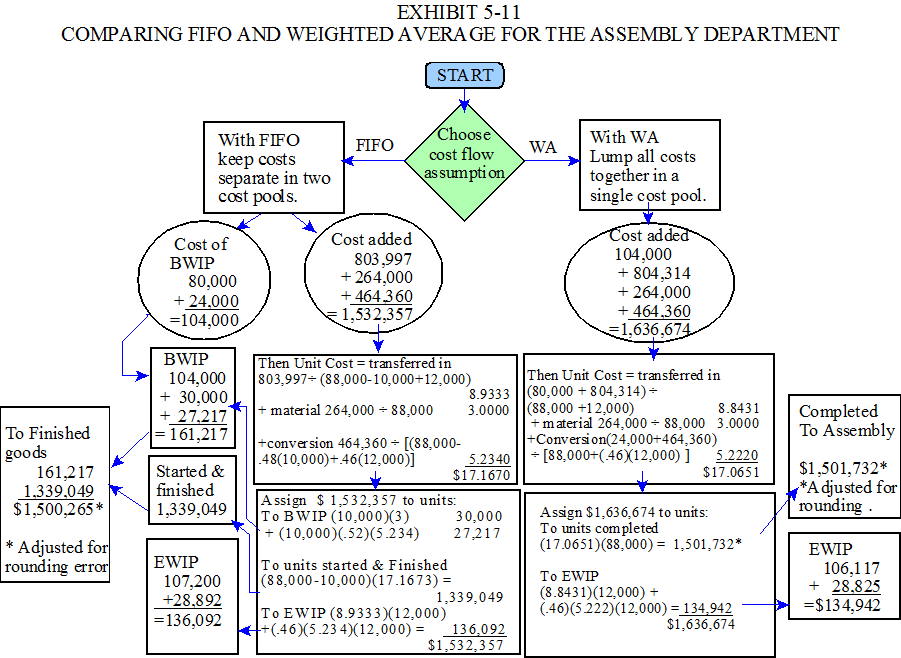
The weighted average unit costs in the Assembly Department are based on the $1,636,674 single cost pool that includes the $104,000 assigned to BWIP at the end of the previous month. Therefore, when assigning the costs to the units based on weighted average, the entire $1,636,674 is spread across the units based on the work performed on the units during both periods (The calculations for weighted average are the same as those in Exhibit 5-6).
ACCOUNTING FOR SPOILAGE IN HISTORICAL PROCESS COSTING
Spoilage, rework, defective units and scrap are defined in Chapter 4. Refer back to those definitions if you need to refresh your memory. This section illustrates how spoilage is accounted for in process costing. Rework and scrap are handled in essentially the same way they are in job order costing. The sections in Chapter 4 that describe the accounting for rework and scrap common to all jobs are also applicable to this chapter.
TREATMENT OF SPOILED OR LOST UNITS
The previous sections of this chapter are definitely prerequisites for this section. However, once you understand the basic accounting techniques for process cost accumulation, then you will be ready for the more realistic problems that include spoilage. You might find it helpful to work one or two problems that do not include spoilage (e.g., Problems 5-1 and 5-2) before you tackle this section. Adding spoilage is a fairly easy step in the learning process, once you have the necessary foundation, but before you reach that point, it tends to be confusing.
WEIGHTED AVERAGE COST FLOW ASSUMPTION
Step I WA. When the weighted average cost flow assumption is used, the equivalent units spoiled (or lost) are added to the denominator in the unit cost calculations. Therefore, Step I includes revising Equation [1 WA] as follows:
[1 WA] Unit Cost WA = (Cost of BWIP + Cost Added during the month) ÷ (Units Completed + Equivalent units in EWIP + Equivalent Units Spoiled or Lost)
The stage of completion of the units spoiled or lost is indicated by the inspection point. For example, if the inspection point is at the end of the process, then the spoiled or lost units are assumed to be 100% complete. If the inspection point is midway through the process, then the spoiled or lost units are considered ½ complete as far as conversion is concerned. If material enters production before the inspection point then the spoiled or lost units are considered 100% complete for material. If material is placed in production after the inspection point, then the spoiled or lost units are 0% complete as far as material is concerned. Both normal and abnormal spoilage are treated in the same way in the unit cost calculations.
Step II WA. When spoiled, or lost units are involved, accounting for the costs includes determining the cost of the normal spoilage and assigning these costs to the units that have been inspected. In addition, the cost of the abnormal spoilage must be determined so that it can be charged to a loss account. The calculations for [2 WA] and [3 WA] are revised as follows:
[2 WA] Cost of Units completed and transferred = Cost transferred to next department
= (Good Units Completed)(Unit Cost) + (Cost of Normal
Spoilage*)(Proportion Applicable to Units Transferred**)
+ Cost transferred to Loss Account = (Equivalent Units of Abnormal Spoilage)(Unit Cost) - Disposal Value
[3 WA] Cost of EWIP = (Unit Cost)(Equivalent Units in EWIP) + (Cost of Normal Spoilage*)(Proportion Applicable To EWIP**)
* (Equivalent Units of Normal Spoilage)(Unit Cost) - Disposal ValueIf the inspection point is at the end of the process, then only the units that have been completed share the normal spoilage costs. The proportion applicable to the units transferred will be 1, i.e., 100 percent. However, if the units in ending work in process have been inspected, then these units share the cost of normal spoilage with the other units that have been inspected. This situation can occur when the inspection point is before the end of the process and the EWIP units have passed that point. Then, the applicable proportions in the calculations above are based on the ratio of the number of good units in each category (i.e., transferred and EWIP), to the total good units in both categories.
If reasonably accurate estimates of the disposal values of the spoilage can be made, these amounts are subtracted in determining the spoilage costs as indicated in Equations [2 WA] and [3 WA]. Then the disposal value is charged to a spoilage inventory account until sold. The offsetting credit is to the work in process account.
FIRST-IN FIRST-OUT COST FLOW ASSUMPTION
When the FIFO cost flow assumption is used, a complicating problem arises. This involves determining which category of completed units the spoilage came from. If the spoiled or lost units are assumed to have come from the units started during the period, then the equivalent units spoiled or lost are added to the denominator in the unit cost calculation [1 FIFO]. Note, that this is the same way spoilage is handled in the weighted average method. It is the usual treatment because it is not practical to identify the source of each spoiled or lost unit. However, if the spoiled or lost units are assumed to have come from the beginning work in process, then only the equivalent work performed on them during the period is included in the denominator. To simplify, we will assume that any spoiled or lost units come from the units started during the period. With this assumption, the treatment of spoiled and lost units is essentially the same in both FIFO and weighted average. These techniques are illustrated in Example 5-2 presented below.
The Texas Tanning Company produces leather from animal hides. Relevant information for the Tanning Department is provided in Exhibit 5-12. The materials, (raw hides) are added at the beginning of the process where they are hung on racks and dipped in a tanning solution. The inspection point is at the end of the process when the hides are removed from the solution. Spoilage up to five percent of the good completed units (leather hides) is considered normal. Any spoilage above this level is considered abnormal. For convenience, all spoilage is assumed to come from the units started during the period and have a disposal value of $2 per unit.
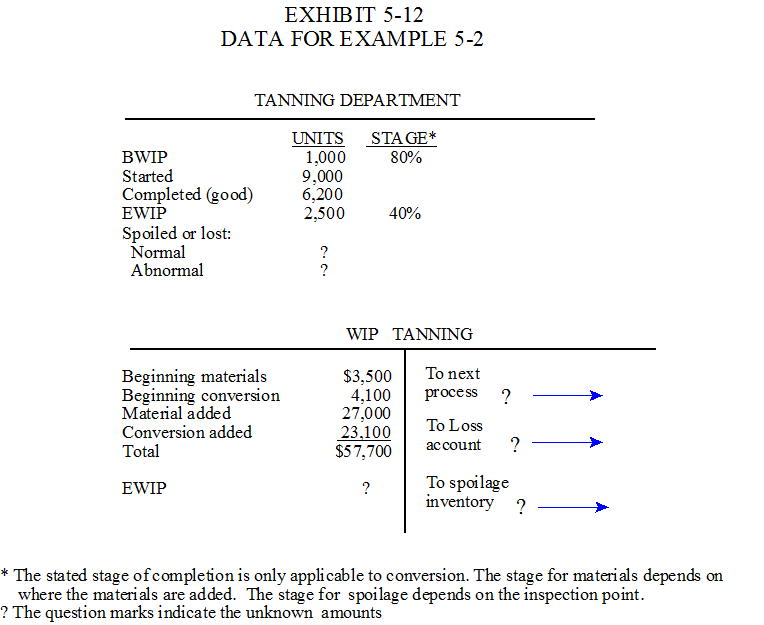
StepI Both Methods. The solutions to Example 5-2 for both the weighted average and FIFO cost flow assumptions appear in Exhibit 5-13. The unit cost calculations are developed in the same way as those presented in the previous example except that the 1,300 units of spoilage are added to the denominator. The number of spoiled units is determined by entering the known values in the equation that defines the relationships between the various categories of units. A note at the bottom of Exhibit 5-13 shows this calculation. The entire 1,300 units of spoilage are 100% complete because the inspection point is at the end of the process. Thus, 1,300 units are added to the denominator in the unit cost calculations for both material and conversion.
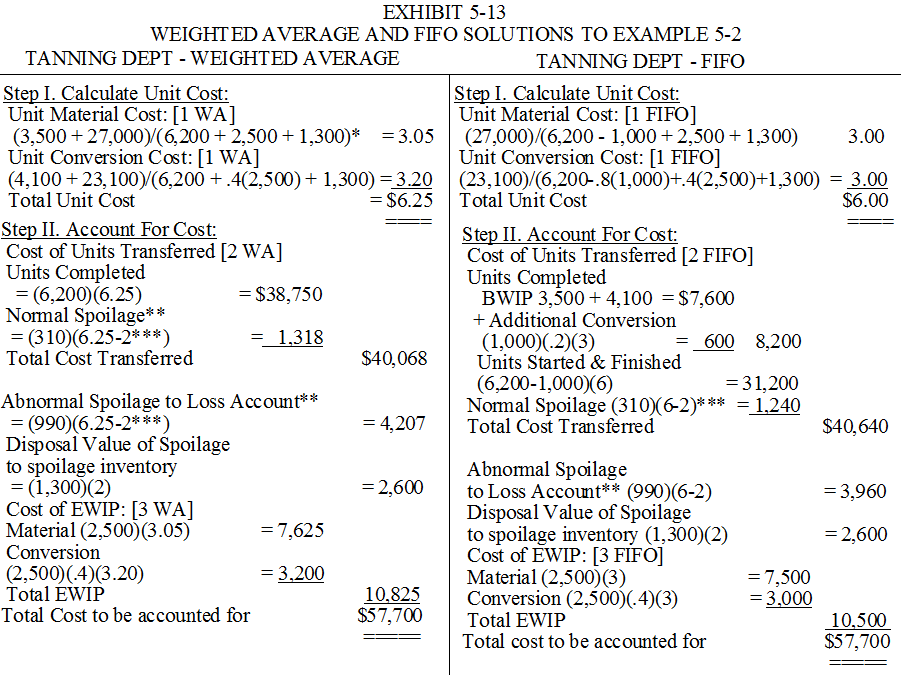
Notes apply to both sides of the Exhibit:
* Spoiled Units = 1,000+9,000-6,200-2,500 = 1,300.
** Normal Spoilage = (.05)(6,200) = 310. Abnormal Spoilage = 1,300-310 = 990.
*** Total unit cost less disposal value. Answers rounded in WA solution.
Step II Both Methods. The procedure to determine the costs of units transferred includes three new calculations in both cost flow assumptions. These include calculating the cost of the normal spoilage, the abnormal spoilage and the disposal value of the spoiled units. Since any spoiled units up to five percent of the good completed units are considered normal, 310 units (.05 multiplied by 6,200), are treated as normal spoilage and the other 990, (1,300 - 310) are treated as abnormal spoilage. The $2 per unit disposal value is subtracted from the unit cost in determining the (unrecoverable) cost of normal and abnormal spoilage. The disposal value is charged to a spoilage inventory account until these units are sold.
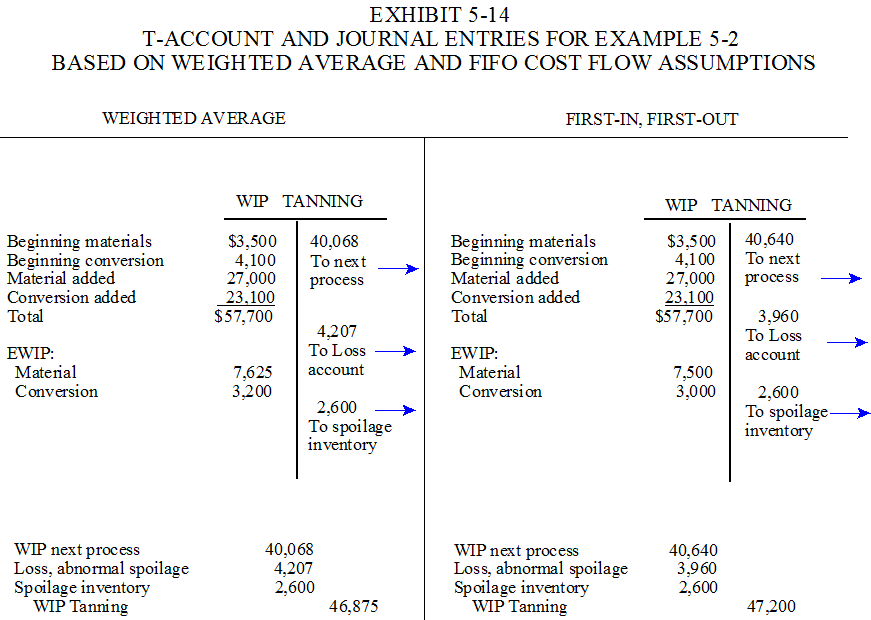
Step III Both Methods. In accounting for the costs, no spoilage costs are charged to the units in ending work in process (in either weighted average or FIFO) because the units in the ending inventory have not passed the inspection point. Therefore, the cost assigned to EWIP is calculated in the manner illustrated in the previous example. The entries to record the cost flows are illustrated in Exhibit 5-14.
Alternative Methods of Accounting For Spoilage
There are some alternative methods of accounting for spoilage in process costing. For example, some companies do not include the number of units spoiled in the unit cost calculations. Conceptually, this is a less accurate method because the spoilage costs are spread over all units whether or not they have passed the inspection point. However, when the spoilage costs are not significant, this is an acceptable method. Another approach that could be used involves including spoilage in the departmental overhead rate calculations. Then spoilage costs are applied along with all other overhead costs. Actual normal spoilage costs, less any disposal value, is charged back to factory overhead. It is not practical to illustrate all possible methods in a textbook, but you should be aware that many alternatives exist.
SYSTEM RELATED TO SYSTEM FUNCTIONS
Most of the discussion that appears under the heading of "Normal Historical Costing Related To System Functions" in Chapter 4, is also applicable to the cost system described in this chapter. The normal historical, full absorption, process cost system described in this chapter is adequate for satisfying GAAP external reporting requirements (Function 1 in Exhibit 2-4). However, it is inadequate for planning and controlling activities and processes (Function 2) because of the timing lags in reporting and the cost aggregations involved. Since the overhead variance analysis presented in Chapter 4 is also applicable to this chapter, the cost system described in this chapter also provides some general information for monitoring overhead costs. But it does not provide similar information concerning direct material and direct labor. This deficiency relates to the basic system, i.e., normal historical costing, not to the cost accumulation method involved.
From the product costing perspective, process cost accumulation tends to provide more accurate product cost than job order costing because there is much less product and volume diversity in process costing. In a job order cost environment, there are many different product variations and volume levels prescribed by customer specifications. In a process cost environment, there is considerably less product diversity and the production volume is controlled by overall demand, not specific customer demands. Therefore, process cost accumulation tends to satisfy the requirements of function 3 (e.g., short term decisions such as pricing products) better than job order costing because there is less diversity in the manufacturing environment. Long term strategic decisions (Function 4 in Exhibit 2-4) require special study and analysis in either of the two systems described in Chapters 4 and 5. The next five chapters discuss improvements in the cost system that enhance the value of the information provided to satisfy the requirements of system functions 2 and 3.
FOOTNOTE
1 The reason for this is explained later in this chapter. See the section on spoilage.
1. What is the main difference between process costing and job order costing? (See Chapter 2)
2. What is transferred-in cost? (See Terminology Concepts)
3. How is unit cost calculated in a job order cost system?
4. Generally, how is unit cost calculated in a process cost system?
5. Which cost accumulation method, job order or process costing, is more involved as far as the bookkeeping aspect is concerned? Why?
6. What is an equivalent unit?
7. When do we need a cost flow assumption to calculate unit cost in process costing? (See Exhibit 5-4)
8. What is the conceptual difference between the weighted average and FIFO unit cost calculations? (See Exhibit 5-4)
9. Conceptually, what is the numerator in the weighted average unit cost calculation? (See Exhibit 5-4)
10. Conceptually, what is the denominator in the weighted average unit cost calculation? (See Exhibit 5-4)
11. Conceptually, what is the numerator in the FIFO unit cost calculation? (See Exhibit 5-4)
12. Conceptually, what is the denominator in the FIFO unit cost calculation? (See Exhibit 5-4)
13. Why do two separate unit cost calculations need to be made for direct materials and conversion costs?
14. What makes combining direct labor and overhead for unit cost calculations an acceptable procedure?
15. In process costing, which cost flow assumption provides the most accurate product cost? Why?
16. Do we need a predetermined overhead rate in process costing? In developing your answer, consider the reasons for using a predetermined overhead rate discussed in Chapter 4.
17. Is overhead more accurately traced to products in process costing or job order costing? Why?
18. Which cost flow assumption requires a two part calculation for the cost transferred out?
19. Why is this two part calculation needed?
20. Is process costing only used by manufacturers? (See Chapter 2)
21. Can you think of any service organizations that use process costing? (See Chapter 2)
22. Do you think control charts are more useful in a process cost environment or a job order cost environment? Why?
23. How would the overhead variance analysis differ in normal historical process costing compared to normal historical job order costing?
24. How well does the cost system described in this chapter satisfy the four functions of a system discussed in Chapter 2? (See Exhibit 2-4)
PROBLEM 5-1
THIS PROBLEM DOES NOT INCLUDE SPOILAGE. WEIGHTED AVERAGE AND FIFO COST FLOW ASSUMPTIONS.
The Bilco Co. produces a product in two processing departments, Forming and Assembly. Direct material is placed in production at the beginning of the process in Forming and at the end of the process in Assembly. Relevant information for a month is provided below. The stage of completion refers to the average stage as far as conversion is concerned.
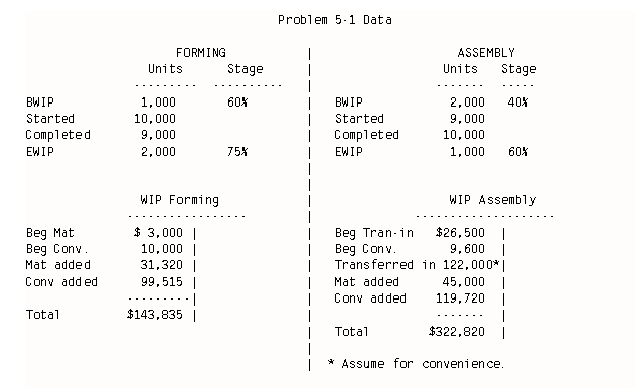
1.) Assume Bilco uses the weighted average cost flow assumption. Determine the unit costs as indicated on the following page. Then determine the costs of the units in the ending inventory and the cost of the units completed and transferred. When working with the Assembly Department assume the cost transferred-in was $122,000 regardless of your calculations in the Forming Department.
2.) Solve the problem assuming Bilco uses the FIFO cost flow assumption. Assume, as in question 1 that $122,000 is transferred to Assembly. Round unit cost to four decimal places. Round all other answers to dollars.
PROBLEM 5-2
THIS PROBLEM DOES NOT INCLUDE SPOILAGE. SECOND DEPARTMENT, WEIGHTED AVERAGE AND FIFO COST FLOW ASSUMPTIONS.
The Rival Company produces a single product in two processes. The following information is provided for the second department.
| Units | Stage | |
| Beginning work in process | 100 | .90 |
| Transferred in | 400 | |
| Completed and transferred out | 450 | |
| Ending work in process | 50 | .80 |
| Work in Process #2 | |
| Beg. Transferred in | $2,000 |
| Beg. Conversion | $4,000 |
| Transferred in | $12,000 |
| Material added | $10,000 |
| Conversion added | $20,000 |
Material is added at the end of the process and spoilage does not occur.
REQUIRED:
Part I. Assume the weighted average cost flow assumption is used and determine the following amounts.
1. Unit transferred in cost.Part II. Assume the FIFO cost flow assumption is used and calculate the five requirements listed in Part I.
PROBLEM 5-3
THIS PROBLEM DOES NOT INCLUDE SPOILAGE. SECOND DEPARTMENT, WEIGHTED AVERAGE AND FIFO COST FLOW ASSUMPTIONS. (ALTERNATIVE FOR 5-2)
The Ajax Company produces a single product in two processes. The following information is provided for the second department.
| Units | Stage | |
| Beginning work in process | 1,000 | .75 |
| Transferred in | 9,000 | |
| Completed and transferred out | 9,500 | |
| Ending work in process | 500 | .80 |
| Work in Process #2 | |
| Beg. Transferred in | $ 24,000 |
| Beg. Conversion | $ 20,000 |
| Transferred in | $ 90,000 |
| Material added | $ 60,000 |
| Conversion added | $ 200,000 |
Material is added at the end of the process and spoilage does not occur.
REQUIRED:
Part I. Assume the weighted average cost flow assumption is used and determine the following amounts.
1. Unit transferred in cost.
2. Unit material cost.
3. Unit conversion cost.
4. The cost transferred to finished goods.
5. The cost of the ending inventory of work in process.
Part II. Assume the FIFO cost flow assumption is used and calculate the five requirements listed in Part I.
PROBLEM 5-4
THIS PROBLEM INCLUDES SPOILAGE WITHOUT A DISPOSAL VALUE. FIFO COST FLOW.
The Blending Department of the Mattall Company uses the FIFO cost flow assumption. Material is added at the beginning of the production process. The inspection point is at the end of the process and spoilage (or lost units) up to 20% of good output is considered normal. Spoilage (or lost units) in excess of 20% is treated as abnormal. All spoilage (or lost units) is assumed to come from the units started during the period. The relevant data are given below:
| Units | Stage | |
| Beginning work in process | 1,000 | 60% |
| Started | 9,000 | |
| Completed | 6,200 | |
| Ending work in process | 2,400 | 40% |
| Spoilage | ? |
| Work in Process | |
| Beginning Material | $8,000 |
| Beginning Conversion | 16,000 |
| Material Added | 22,800 |
| Conversion Added | 52,000 |
REQUIRED
1. Determine the unit material cost.
2. Determine the unit conversion cost.
3. Calculate the cost transferred out to the next department.
4. Calculate the cost transferred to a loss account if any.
5. Calculate the cost of the ending inventory of work in process.
PROBLEM 5-5
THIS PROBLEM INCLUDES SPOILAGE WITHOUT A DISPOSAL VALUE. WEIGHTED AVERAGE COST FLOW.
The Bow Co. produces a product in two processing departments, Forming and Assembly. Direct material is placed into production at the beginning of the process in Forming and at the end of the process in Assembly. Assume Bow Co. uses the weighted average cost flow assumption. When working with the Assembly Department assume the cost transferred-in was $109,500 regardless of your calculations in the Forming Department. The inspection point is at the end of the process in both departments and that any spoilage is considered normal. Bow Company does not ignore spoilage.
| FORMING | ASSEMBLY | |||||
| Units | Stage | Units | Stage | |||
| BWIP | 1,000 | 60% | BWIP | 2,000 | 40% | |
| Started | 10,000 | Started | 8,000 | |||
| Completed | 8,000 | Completed | 9,000 | |||
| EWIP | 2,000 | 75% | EWIP | 1,000 | 60% | |
| WIP Forming | WIP Assembly | |||
| Beg Mat | $2,000 | Beg Tran-in | $26,500 | |
| Beg Conv | 12,000 | Beg Conv | 9,600 | |
| Mat added | 31,000 | Transferred in* | 109,500 | |
| Conv added | 85,280 | Mat added | 45,000 | |
| Total | 130,280 | Conv added | 109,440 | |
| Total | 300,040 | |||
* Assume for convenience.
REQUIRED FOR FORMING
1. Unit Material Cost.
2. Unit Conversion Cost.
3. Cost of Ending WIP.
4. Cost of Units Completed
REQUIRED FOR ASSEMBLY
5. Unit Transferred in Cost.
6. Unit Material Cost.
7. Unit Conversion Cost.
8. Cost of Ending WIP and Transferred to Assembly.
9. Cost of Units Completed and transferred to Finished Goods.
PROBLEM 5-6
THIS PROBLEM INCLUDES SPOILAGE AND A DISPOSAL VALUE. WEIGHTED AVERAGE AND FIFO COST FLOW ASSUMPTIONS.
The Berry Company produces a product in a process cost environment. The following information is provided for the first department in the process.
| Units | Stage | |
| Beginning work in process | 2,000 | .75 |
| Started | 8,000 | |
| Completed (Good) | 7,500 | |
| Ending work in process | 1,700 | .60 |
| Work in Process #1 | |
| Beg Material | $14,000 |
| Beg Conversion | 20,000 |
| Material added | 58,000 |
| Conversion added | 104,500 |
Material is added at the beginning of the process and the inspection point is at the end of the process. All spoilage is assumed to come from the units started during the period. Any spoilage up to ten percent of the good completed units is considered normal. Spoilage above ten percent is considered abnormal. Spoiled units have a disposal value of $4 each. Berry Company charges this amount to a spoilage inventory account until the spoilage is sold.
REQUIRED: Determine the following amounts.
1. Total spoilage (in units).
2. Normal spoilage (in units).
3. Abnormal spoilage (in units).
Assume a weighted average cost flow, calculate the following and round your answers to four decimal places.
4. The unit material cost.
5. The unit conversion cost.
6. The cost transferred to the next department.
7. The cost transferred to a loss account if any.
8. The cost transferred to the spoilage inventory account.
9. The cost allocated to the ending inventory of work in process.
10. Make the appropriate journal entry to record the cost flow.
Now assume a FIFO cost flow, calculate the following and round your answers to four decimal places.
11. The unit material cost.
12. The unit conversion cost.
13. The cost transferred to the next department.
14. The cost transferred to a loss account if any.
15. The cost transferred to the spoilage inventory account.
16. The cost allocated to the ending inventory of work in process.
17. Make the appropriate journal entry to record the cost flow.
PROBLEM 5-7
THIS PROBLEM INCLUDES SPOILAGE. WEIGHTED AVERAGE AND FIFO COST FLOW ASSUMPTIONS. EMPHASIS ON WEIGHTED AVERAGE.
Wheel Company I. The following information is given for the second department in a process cost environment.
| Units | Stage | |
| Beginning work in process | 1,000 | .60 |
| Started | 9,000 | |
| Completed (Good) | 9,200 | |
| Ending work in process | 600 | .80 |
| Spoilage | ? |
| Work in Process #2 | |
| Beg transferred in | $12,000 |
| Beg Conversion | 20,000 |
| Transferred in | 102,600 |
| Conv added | 210,000 |
| Material added | 61,000 |
Material is added at the end of the process. Inspection is also at the end of the process after the material is added. Spoilage up to five percent of good completed units is considered normal. Any spoilage is assumed to come from the units started during the period. Note: Unit cost calculations are rounded to four decimal places.
REQUIRED:
1. The unit transferred-in cost based on a weighted average cost flow is:
a. $11.1696
b. $11.6939
c. $11.4000
d. 11.4600
e. None of these.
2. The unit material cost based on a weighted average cost flow is:
a. 6.5733
b. 6.4894
c.6.6304
d. 6.7778
e. None of these.
3. The unit conversion cost based on a weighted average cost flow is:
a. 22.6293
b. 23.0263
c.23.2794
d. 22.0126
e. None of these.
4. Now, ignore your previous calculations and assume that the unit costs using weighted average are: transferred-in = $11, material = $6, and conversion = $23. The cost transferred
to the next department using the weighted average method would be: (Note: Answers will not agree with the total cost to be accounted for.)
a. $376,000
b. $368,000
c. $360,000
d. $383,200
e. None of these.
5. Now, ignore your previous unit cost calculations and assume the unit costs using FIFO are: transferred-in $11,
material = $6, conversion = $23. The costs charged to the next department using FIFO would be: (Note: Answers will not agree with the total cost to be accounted for.)
a. $376,000
b. $368,000
c. $383,200
d. $336,000
e. None of these.
PROBLEM 5-8
THIS PROBLEM INCLUDES SPOILAGE.
WEIGHTED AVERAGE AND FIFO COST FLOW ASSUMPTIONS. EMPHASIS ON FIFO.
Wheel Company II. The following information is given for the second department in a process cost environment.
| Units | Stage | |
| Beginning work in process | 1,000 | .60 |
| Started | 9,000 | |
| Completed (Good) | 9,200 | |
| Ending work in process | 600 | .80 |
| Spoilage | ? |
| Work in Process #2 | |
| Beg transferred in | $12,000 |
| Beg Conversion | 20,000 |
| Transferred in | 102,600 |
| Conversion added | 210,000 |
| Material added | 61,000 |
Material is added at the end of the process. Inspection is also at the end of the process after the material is added. Spoilage up to five percent of good completed units is considered normal. Any spoilage is assumed to come from the units started during the period. Note: Unit cost calculations are rounded to four decimal places.
REQUIRED:
1. The unit transferred-in cost using FIFO is:
a. $10.3846
b. $11.0799
c. $11.4000
d. 11.4600
e. None of these.
2. The unit material cost using FIFOis:
a. 6.5733
b. 6.4894
c. 6.6304
d. 6.7778
e. None of these.
3. The unit conversion cost using FIFOis:
a. 22.6293
b. 23.0263
c. 23.2794
d. 22.0126
e. None of these.
4. Now, ignore your previous unit cost calculations and assume the unit costs using FIFO are: transferred-in $10,
material = $6, conversion = $20. The costs charged to the next department using FIFO would be:
a. $331,200
b. $342,400
c. $348,400
d. $338,400
e. None of these.
5. Now, ignore your previous calculations and assume that the unit costs using weighted average are:
transferred-in = $10, material = $6, and conversion = $20. The cost transferred to the next department using the weighted average method would be:
a. $331,200
b. $342,400
c. $348,400
d. $338,400
e. None of these.