Chapter 7 Solutions
James R. Martin, Ph.D., CMA
Professor Emeritus, University of South Florida
Chapter 7 | MAAW's Textbook Table of Contents
SOLUTION 7-1
1. The ABC activity overhead rates are:
Non production volume related pool 66,600 ÷ 3 = 22,200 per PO.
Production volume related pool 303,000 ÷ 10,100 = 30 per DL hour.
ABC Cost traced to V1:
(22,200)(1 PO) + (30)(100 DL hours) = $25,200.
Unit cost of V1 = 25,200 ÷ 100 = $252 for overhead.
Add $50 for DM and $10 for DL and the unit ABC cost of V1 is $312.
ABC Cost traced to V3:
(22,200)(2 PO's) + (30)(10,000 DL hours) = 44,400 + 300,000 = $344,400.
Unit cost of V3 = 344,400 ÷ 1,000 = $344.40 for overhead.
Add $500 for DM and $100 for DL and the ABC unit cost of V3 is $944.40
2. The traditional overhead rate is:
$369,600 ÷ 10,100 = $36.5941 per DL hour.
Unit cost of V1:
(36.5941)(1) = 36.59 for overhead.
Add $60 for DM and DL and the traditional unit cost of V1 is $96.59.
Unit cost of V3:
(36.5941)(10) = $365.94 for overhead.
Add $600 for DM and DL and the traditional unit cost of V3 is $965.94.
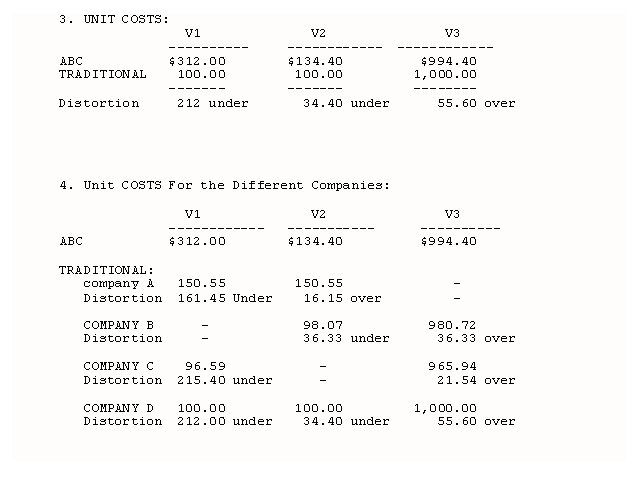
3. V1 is undercosted by $215.40 per unit and V3 is overcosted by $21.54 per unit.
The amount V1 is undercosted (215.40)(100) is equal to the amount V3 is overcosted (21.54)(1000).
4. In example 7-1 V1 is undercosted by 161.45 because of the volume differences. In Company A it is the low volume product, but size is not a factor since the products are both small. In this problem V1 is undercosted by an additional $53.95 because of the size factor. V1 is not only the low volume product, it is also the small product.
In Example 7-2 V3 is overcosted by $36.33 because it is the large product. Production volume was not a factor because products V2 and V3 are both high volume products. In this problem V3 is overcosted by only $21.54. This is because the total distortion is smaller. Although there are two factors causing cost distortions, there are fewer units involved.
SOLUTION 7-2
1. The ABC activity cost rates are:
Non production volume related pool 111,000 ÷ 5 = 22,200 per PO.
Production volume related pool 333,000 ÷ 11,100 = 30 per DL hour.
ABC Cost traced to V1:
(22,200)(1 PO) + (30)(100 DL hours) = $25,200.
Unit cost of V1 = 25,200 ÷ 100 = $252 for overhead.
Add $50 for DM and $10 for DL and the unit ABC cost of V1 is $312.
ABC Cost traced to V2:
(22,200)(2 PO's) + (30)(1,000 DL hours) = $74,400.
Unit cost of V2 = 74,400 ÷ 1,000 = $74.40 for overhead.
Add $50 for DM and $10 DL and the unit ABC cost of V2 is $134.40.
ABC Cost traced to V3:
(22,200)(2 PO's) + (30)(10,000 DL hours) = 44,400 + 300,000 = $344,400.
Unit cost of V3 = 344,400 ÷ 1,000 = $344.40 for overhead.
Add $500 for DM and $100 for DL and the ABC unit cost of V3 is $944.40
2. The traditional overhead rate is:
$444,000 ÷ 11,100 = $40 per DL hour.
Unit cost of V1:
(40)(1) = $40 for overhead.
Add $60 for DM and DL and the traditional unit cost of V1 is $100.
Unit cost of V2:
(40)(1) = $40 for overhead.
Add $60 for DM and DL and the traditional unit cost of V2 is $100.
Unit cost of V3:
(40)(10) = $400 for overhead.
Add $600 for DM and DL and the traditional unit cost of V2 is $1,000.
Solution 7-2 Continued below

Solution 7-2 Continued
The distortion in the unit cost of V1 is the greatest because V1 is both a low volume product and a small product relative to V2 and V3. V2 is overcosted in Company A because it is the high volume product, but undercosted in both companies B and D because it is a small product relative to V3. In Company D it is not clear whether V2 will be over or undercosted, but the distortion caused by V2's small size offsets the fact that V2 is a high volume product relative to V1. V3 is overcosted in all three companies because it is both high volume and large relative to products V1 and V2.
SOLUTION 7-3
1. ABC activity cost rates are:
Purchasing = $400,000 ÷ 160 = $2,500 per ordering hour
Materials handling = $600,000 ÷ 250 = $2,400 per handling
Engineering = $600,000 ÷ 100 = $6,000 per EWO
ABC costs traced to Product A:
($2,500)(100) + ($2,400)(50) + ($6,000)(50) = $670,000
ABC unit cost of Product A = $670,000 ÷ 500 units = 1,340 per unit.
ABC costs traced to Product B:
($2,500)(60) + ($2,400)(200) + ($6,000)(50) = $930,000
ABC unit cost of Product B = $930,000 ÷ 2,000 units = $465 per unit.
2. Traditional overhead rate:
Total direct labor hours are (500)(2 hours) + (2,000)(1 hour) = 3,000 D.L. hours
$1,600,000 ÷ 3,000 = 533.3333
Traditional overhead costs allocated to Product A:
($533.3333)(1,000 hours) = $533,333.33
Traditional unit cost = $533,333.33 ÷ 500 = $1,066.666
Traditional overhead costs allocated to Product B:
($533.3333)(2,000) = $1,066,666.60
Traditional unit cost = $1,066,666.60 ÷ 2,000 = $533.333
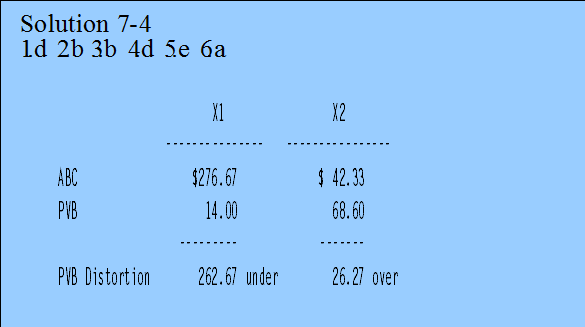
3. e. The unit cost of Product A is understated by $1,340 - 1,066.666 = $273.333.
The unit cost of Product B is overstated by $533.333 - $465 = $68.333
The total distortion is ($273.333)(500) = ($68.333)(2,000) = $136,667
4. a.

SOLUTION 7-5
1. c. (16/40)(100,000) + (100/300)(60,000) + (15/50)(40,000) = 72,000. Then 72,000/2,000 = 36.
2. c. (24/40)(100,000) + (200/300)(60,000) + (35/50)(40,000) = 128,000. Then 128,000/8,000 = 16.
3. d. (16/40)(200,000) = 80,000. Then 80,000/2,000 = 40. Only production volume based allocation methods are used in a traditional cost system. Therefore, machine hours are used because this is the only production volume based measurement available.
4. a 5. d 6. a
7. d. Normally we would expect the cost of the low volume product to be understated by the traditional method and the cost of the large product to be overstated. However, product A is both low volume and large. Since the cost of product A is overstated by the traditional method (40 versus 36 in the ABC method), the effects of A's relatively large size must have offset the effects of A's relatively low volume.

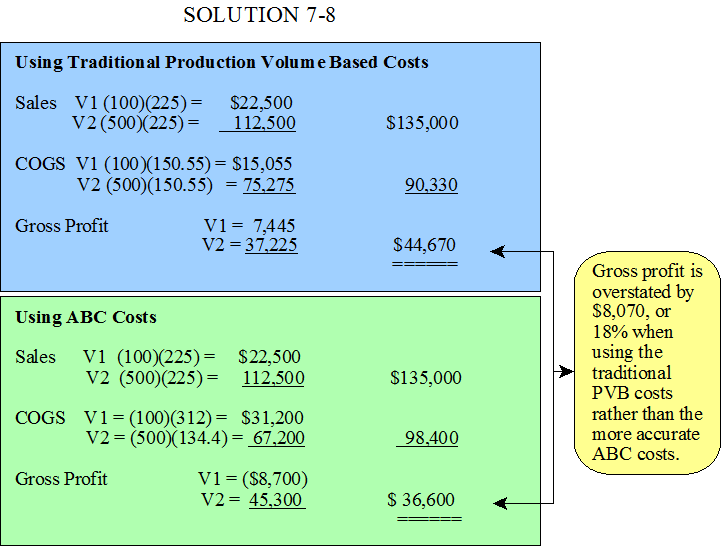
2. The argument that ABC is not needed for external reporting is based on an underlying assumption that most of the inventory will be sold during the period. However, this illustration shows that significant inventory changes (increase in V2 in this illustration), can have a material effect on financial performance and perhaps the decisions made by external users.
Based on the traditional PVB cost allocations Company A management would not know that V1 is unprofitable. But consider what gross profit would be if Company A used ABC and marked both products up by 50% over ABC costs. Then the prices would be V1 (1.5)($312) = $468 and V2 = (1.5)($134.4) = $202 rounded to dollars. Sales would be V1 ($468)(100) + V2 ($202)(500) = $147,800, and gross profit would be $147,800 - $98,400 = $49,400. By having an accurate picture of their product costs, Company A management could increase gross profit by $49,400 - $36,600 = $12,800, or by nearly 35% (i.e., 12,800/36,600 = .3497). Of course increasing the price of V1 from $225 to $468 might not be acceptable to the customer, but Company A management would have a very good case for raising the price, or perhaps finding other alternatives.