Provided by James R. Martin, Ph.D., CMA
Professor Emeritus, University of South Florida
Economics Related Main Page
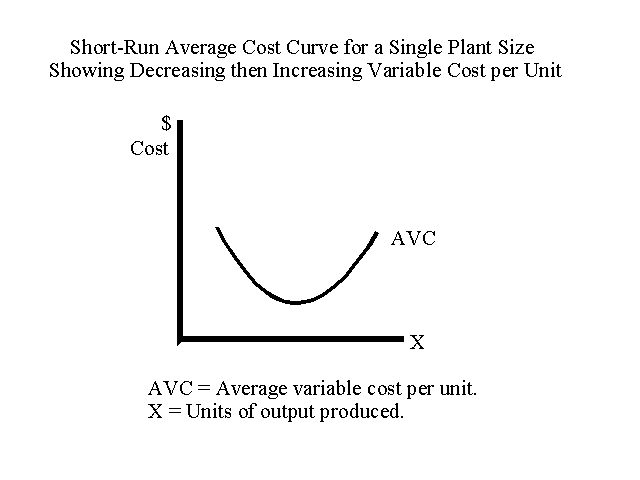
The graphic illustration below (based on Figure 11-12) shows the short-run average cost curve for a specific size plant based on increasing then decreasing productivity. The average cost decreases as productivity increases, then increases after the point of diminishing returns is reached. See Chapter 11 for more on these relationships. An important point to grasp is that the short run average cost curve is U-shaped because of the phenomenon known as diminishing returns.

Economies of Scale versus Diminishing Returns
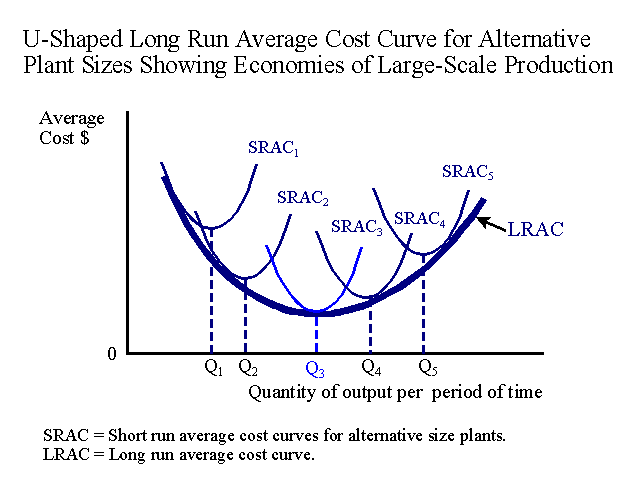
The concept of economies of scale is based on the long-run average cost (LRAC) curve as indicated in the graphic illustration below. The LRAC curve is derived from the short-run average cost (SRAC) curves represented by alternative plant sizes. The U-shaped function drawn tangent to the various short-run cost curves represents the long-run average cost curve and illustrates the concept of economies of scale. An important point to grasp is that the long-run average cost curve is U-shaped because of the phenomenon known as economies of scale.

__________________________________________________
For a great deal more depth on this topic, see Thompson, A. A. Jr. 1973. Economics of the Firm: Theory and Practice. Prentice Hall. Chapter 8.
Related chapter and summaries:
Martin, J. R. Not dated. Chapter 11: Conventional Linear Cost-Volume-Profit Analysis. Management Accounting: Concepts, Techniques & Controversial Issues. Management And Accounting Web. Chapter11
Porter, M. E. 1980. Competitive Strategy: Techniques for Analyzing Industries and Competitors. The Free Press. (Summary).