Provided by James R. Martin, Ph.D., CMA
Professor Emeritus, University of South Florida
TOC Main
Page | TOC Problems Main Page
Buffa Company produces two products, X and Y that are processed in two departments, A and B. The requirements for each product are provided in the table below.
| Resource | Required per unit of Product X |
Required per unit of Product Y |
| Department A | 2 hours | 4 hours |
| Department B | 3 hours | 2 hours |
Weekly capacity is 80 hours for Department A and 60 hours for Department B. Throughput per unit is $60 for X and $50 for Y.
Required:
1. Assume that the company can sell as much of X and Y as it can produce. Determine the number of units of X and Y that should be produced per week to maximize throughput.
2. Now assume that Weekly demand is 12 for Product X and 14 for Product Y. What would be the new product mix needed to maximize throughput?
Solution
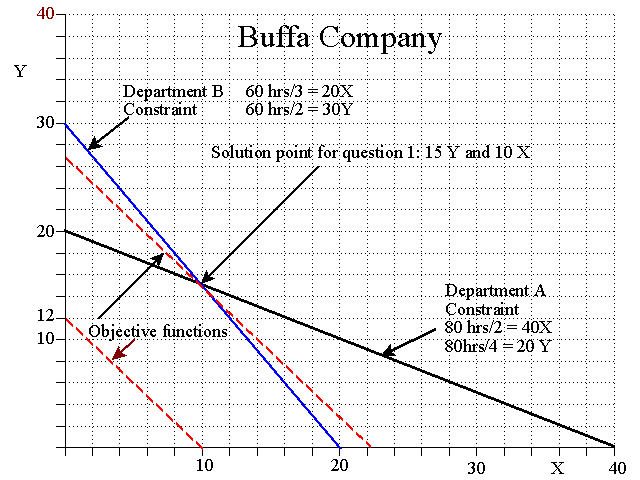
Question 1: Where there are no demand constraints. The Department A constraint is 2X + 4Y = 80 so the company can produce 40 units of X (80/2) or 20 units of Y (80/4) or some combination of X and Y on the line connecting those two points on the graph. The Department B constraint is 3X + 2Y = 60 so the company can produce 20 units of X (60/3) or 30 units of Y (60/2) or some combination of X and Y on the line connecting those two points on the graph.
We can find the solution by checking the throughput at each of the corner points.
1. 20Y @ $50 = $1,000
throughput.
2. 20X @ $60 = $1,200 throughput.
3. 15Y @ $50 + 10X @ $60 = $1,350 throughput.
The last point represents the solution since it produces the greatest throughput.
Another way to find the solution is to plot the objection function. The objection is to maximize throughput = 60X + 50Y. It takes 1.2Y (60/50) to generate as much throughput as 1X, i.e., (1.2)(50) = 60. The first objective function plotted is 12Y and 10X. Moving the objective function up and to the right, parallel to this function indicates the solution point on the graph at 15 units of Y and 10 units of X.

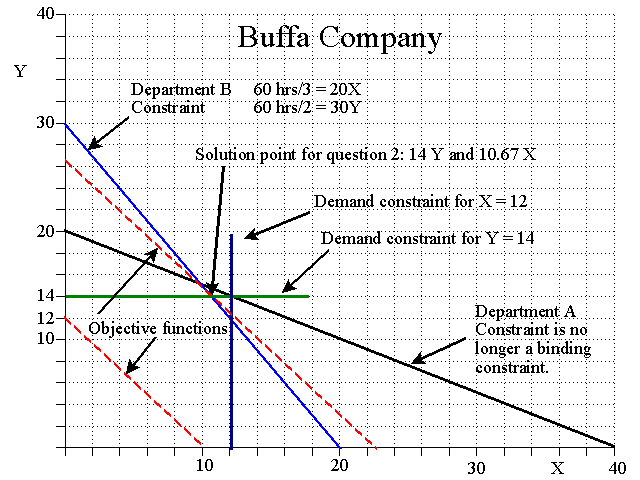
Question 2: Where the demand constraints limit the solution space. We can see that the solution space becomes smaller after plotting the demand constraints and the original solution is no longer feasible.
Checking the throughput at the corner points we have:
1. 14Y @ $50 = $700.
2. 14Y @ $50 + 10.67@ $60 = $1,340.20.
If we use (14)(2 hours) = 28 hours for
Y,
then there are 60-28 = 32 hours left for the production of 10.67 X (i.e.,
32/3).
3. 12X @ $60 = $720.
4. 12X @ $60 + 12Y@ $50 = $1,320.
Point 2 is the solution.
Using the objective function also shows that the point where Y = 14 and X = 10.67 is the solution point since that is the last point within the solution space that the objection function touches as we move it up and to the right.

As indicated in previous illustrations, graphic solutions are only useful for solving simple introductory problems. A technique such as linear programming is needed for more realistic product mix problems. Linear programming and many other techniques are illustrated in operations management and quantitative methods textbooks.
__________________________________________________
*Buffa, E. S. 1963. Models for Production and Operations Management. John Wiley & Sons. Chapter 12.
Related problems and summaries:
Goldratt, E. M. 1990. The Haystack Syndrome: Sifting Information Out of the Data Ocean. New York: North River Press. (Summary).
Martin, J. R. Not dated. TOC Problem 1: Find the constraint and the product mix needed to maximize throughput. Management And Accounting Web. TOCClassProblem1.htm
Martin, J. R. Not dated. TOC Problem 2: Determine the optimum product mix with overlapping constraints. Management And Accounting Web. TOCClassProblem2.htm