Chapter 5
Activity-Based Cost Management Systems
Study Guide by James R. Martin, Ph.D., CMA
Professor Emeritus, University of South Florida
ABKY Main Page |
Martin's Textbook Main Page
This chapter extends the discussion of activity based costing introduced in previous chapters with further discussions of the underlying concepts and provides several additional examples comparing ABC with traditional costing. The major concepts include: 1) cost distortions, i.e., what are they and why traditional cost systems create distortions in product and customer costs, 2) the logic underlying activity based costing, i.e., the connection between resources, costs, activities and cost objects, 3) product diversity, e.g., the relationship between product volume differences, support costs and cost distortions, 4) how ABC models are designed to trace costs accurately, 5) cost drivers, i.e., the appropriateness of various types of measurements that can be used to represent cost drivers, 6) the logic of using practical capacity as the basis for assigning costs to cost objects, i.e., as the basis for the denominator of the activity cost driver rates, 7) why ABC is a strategic system rather than an operational control system, and 8) the constraints, or barriers to implementing ABC.
The Cooper Pen Company example on pages 160-170 illustrates how production volume differences create product cost distortions (See Exhibit 5-1). In their example, the traditional cost system allocates overhead costs using a plant wide rate of 300% of direct labor costs. This causes the high volume products (blue and black pens) to be charged with too much overhead and the low volume products (red and purple pens) to be charged with too little overhead. The reason for these distortions is revealed by the faulty assumption underlying the traditional cost allocation system, i.e., that all overhead costs are driven by production volume, or that the link between cause (driver) and effect (cost) cannot be established. Traditional cost systems treat all overhead costs as unit level costs. However, as ABKY explain, production volume is only one of many cost drivers. A factory producing a large variety of products will have a much greater need for support (e.g., purchasing, scheduling, setup, order tracking and quality control) than a factory that produces a few products.
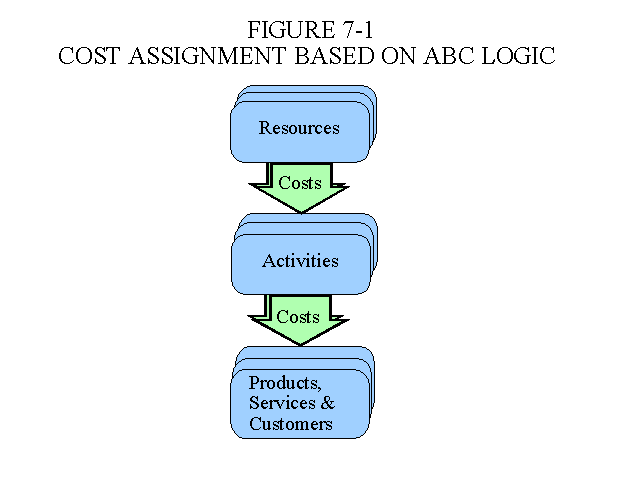
The logic underlying activity based costing is simply that resources generate costs, activities consume resources and cost objects such as products, services and customers consume activities. The illustration below from MAAW's Textbook Chapter 7 illustrates the concept. Resource costs are traced to cost objects in two stages. In the first stage, the costs of various resources are assigned to the activities that consume the resources. In the second stage, the costs associated with activities are assigned to cost objects that require and consume the activities.
As the Cooper Pen Company example illustrates, when production volume diversity exists, using a production volume based allocation method tends to cause high volume products to be charged with too much overhead and low volume products to be charged with too little overhead. Many other types of product differences also create cost distortions as indicated in the illustration below from MAAW's Textbook Chapter 7.
|
Exhibit 7-1 Summary of Cost Distortions that tend to occur in Traditional Cost Systems |
||
| Type of Diversity | Product Type or Characteristic | Type of Cost Distortion |
| Production volume |
Low Volume specialty |
Undercost, i.e., too little overhead is allocated to these products. |
| High Volume main line | Overcost, i.e., too much overhead is allocated to these products. | |
|
Product Size |
Small |
Undercost |
| Large | Overcost | |
| Product Complexity |
Complex design |
Undercost |
| Simple design | Overcost | |
| Product Materials requirements |
Requires many, or unique parts, i.e., only used on a single product. |
Undercost |
| Requires few, or common parts, i.e., same part used on many products. | Overcost | |
|
Product Machine setup requirements |
Requires many, long or complex machine setups. |
Undercost |
| Requires few, short or simple machine setups. | Overcost | |
5. How ABC Models are Designed
ABKY discuss the steps in designing an ABC system in more than one section of this chapter, e.g., see pages 164 and 183. The steps are as follows:
1. Identify the company's main activities. ABKY refer to this as constructing an activity dictionary.
2. Identify the resources and resource costs used by each activity.
3. Identify what drives, or causes the activities to be performed.
4. Select a measurement for the activity driver. Types of activity measurements are discussed below.
5. Calculate an activity rate for each activity as indicated in Chapter 4.
Activity cost driver rate = Normal cost of support activity ÷ Normal level of driver where normal
level is defined as the
long run capacity
made available. Note this is
practical capacity
as indicated below and on page 174.
6. Use the activity cost driver rates to assign costs to cost objects.
The Cooper Pen Company example shows how the model is developed and used. The Company produces Blue, Black, Red and Purple Pens. Four activities are identified along with the drivers and measurements used to represent the volume of work in each activity.
| Cooper Pen Company | ||
| Activity | Driver | Measurement |
| Fringe benefits for direct labor. | Direct labor. | Direct labor costs. |
| Run machines. | Production volume. | Number of machine hours at 1/10 hour per unit produced. |
| Handle production runs. | Production batches. | Number of production runs or batches. |
| Set up machines. | Production batches. | Number of setup hours. |
| Support products. | Products sustaining requirements. | Number of products. |
Resource costs are traced to each activity on page 166. Then the costs associated with each activity, along with the activity volumes, are identified and used to calculate activity rates. This is shown in Exhibit 5-6. Then the costs assigned to each type of pen is determined with the following equation.
ABC Cost Assignments = (Direct labor costs)(.40) for fringe benefits
+ (Product volume in MH)($4.20 per MH) for running machines
+ (Number of runs)($440 per run) for handling
+ (Number of setup hours)($63.88 per hour) for setups
+ ($3,600 per product) for product support
The ABC cost assignments for Blue Pens are as follows:
= ($30,000)(.4) = $12,000 for fringe benefits
+ (5,000 MH)($4.20) = 21,000 for running machines
+ (50 runs)($440) = 22,000 for handling
+ (200 hours)($63.88) = 12,776 for setups
+ 3,600 = 3,600 for product support
Total ABC cost assigned = $71,376
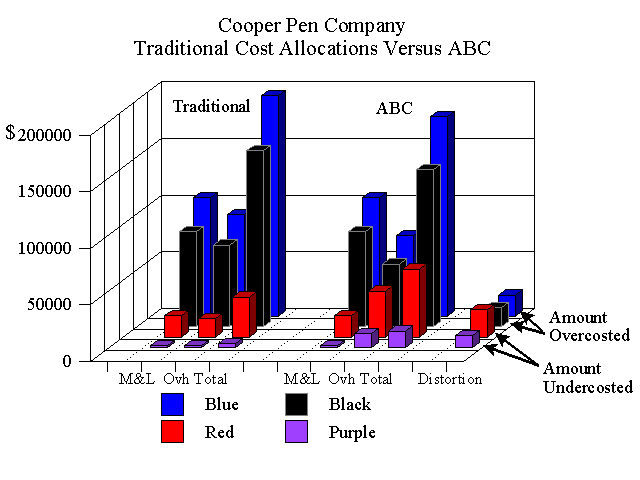
Since the traditional cost allocation to Blue pens on page 161 is $90,000, the cost distortion is $18,624 (90,000 - 71,376) for this product. The distortion can also be calculated by comparing the operating income amounts on pages 161 and 170, i.e., $48,624 for Blue pens based on ABC versus $30,000 based on the traditional cost allocation method.
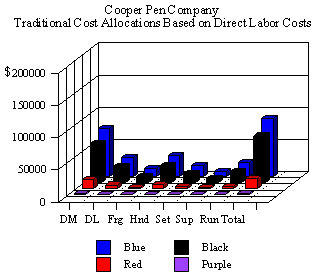
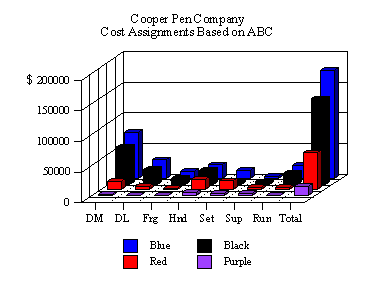
These calculations are illustrated on page 170 for the other products. Note: I included fringe benefits as an activity because it is needed to show the total amount of the cost and income distortions. Although ABKY do not include it in Exhibit 5-7, it does appear in Exhibit 5-8. The illustrations below show graphic views of the traditional and ABC approaches.


6. Types of Cost Driver Measurements
Different types of measurements are needed in different situations. For example, if all setups take the same amount of time, then using the number of setups would provide accurate cost assignments. If some setups are long and some are short, a duration measurement like setup hours would work. If time per setup does not capture the cost because more resources are needed for some product setups, then an intensity measurement approach might be needed for accurate setup cost assignment. In some cases where moving costs and packing costs are involved, a physical measurement might be appropriate.
| Term | Defined | Example |
| Activity measure | A unit of measure chosen to represent the activity volume. Usually a secondary driver. | See below and page 184. |
| Transaction or Frequency measures | The number of times an activity is performed. | Number of purchase orders, number of engineering work orders. |
| Duration measures | The time consumed performing the activity. | Ordering hours, engineering hours, machine hours. |
| Physical measures | The quantity of a resource processed by an activity. | Cubic feet packed, pounds shipped. |
| Intensity measures | Direct charging based on resources used. | A combination of measurements. |
7. The Logic of Using Practical Capacity
The section on page 174 related to using practical capacity as the basis for calculating cost driver rates follows from their previous discussion in Chapter 4. When activity cost rates are based on practical capacity, the cost assigned to products represents the cost of resources used. The cost of unused capacity remains unassigned. This approach provides information needed for managing capacity ( e.g., eliminate or find new uses for excess resources ) , as well as information for better pricing decisions .
8. Strategic versus Operational Control Systems
ABKY compare strategic control and operational control on page 11 of Chapter 1. Activity based costing is a strategic system used to provide information needed for strategic decisions such as product pricing and whether to increase or decrease capacity. It is not an operational control system. Most ABC models are used as separate strategic support systems outside the general ledger accounting system.
As ABKY point out on page 181, service companies are ideal candidates for ABC because of their characteristics.
Characteristics of Service Companies :
1. Most costs are indirect and appear to be fixed. Variable costs tend to be small and frequently near zero.
2. Most costs are capacity related cost. Remember from Chapter 3, these are costs that are based on the amount acquired, rather than the amount used.
3. Most costs are customer specific rather than customer independent (see the top of page 183 for their discussion of this point).
Examples ABC Models developed for Service Companies:
ABKY provide several examples in Chapter 5 including banks, airlines, the food industry and the U.S. Post Office. There are examples of an electric company and a landscaping business in Chapter 3 and an auto service in Chapter 4. Ruhl & Hartman (1998) discuss ABC models that were developed for financial services, hospitals and insurance companies.
10. Barriers to Implementing ABC
The following points are discussed on pages 184-188.
1. Lack of a clear business purpose. ABC can't be an accounting exercise. It must be motivated by a purpose such as: to aid in the redesign of processes, provide better product mix decisions, or to influence product design decisions.
2. Lack of top management support. To obtain cross-functional support a new initiative such as activity based costing needs the support of senior management.
3. Delegating the ABC project to consultants. Many consulting firms provide software and consulting for developing activity based costing models. But cross functional teams from inside the company are needed for successful implementations.
4. Poor ABC design. Too many measurements or measurements that are too difficult and time consuming to capture add more work for people who see no benefits.
5. Natural resistance to change. Change is risky.
1. What is the difference between production departments and service departments? (See Chapter 4).
2. What are the two stages of cost allocations in conventional product costing systems? (See Chapter 4 summary item 10.)
3. Why are conventional two-stage cost allocation systems likely to systematically distort product costs? (This question is about cause and effect. See item 3 above).
4. What are two factors that contribute to cost distortions resulting from the use of conventional two-stage cost allocation systems? (See item 2 above).
5. What fundamental assumption implicit in conventional two-stage cost allocation systems is rejected in activity-based costing systems? (See item 2 above).
6. What do the terms activity cost driver and activity cost driver rates mean? (See Chapter 4 Summary item 3).
7. What major steps must be performed to determine the activity cost driver rates? (See item 5 above).
8. What are some special considerations in the design of cost accounting systems for service organizations? (See item 9 above).
9. When would you prefer to use the number of setups instead of the number of setup hours as the cost driver measure for the setup activity? (See item 6 above).
10. How do activity-based costing systems avoid distortions in tracing batch-related costs to products? (See item 6 above).
11. Why do conventional product costing systems often exclude selling and distribution costs? (The answer is related to the matching concept and GAAP).
12. What recent changes have made it more important to have nonmanufacturing costs assigned to products, product lines, or market segments?
13. Why are conventional product costs systems more likely to distort product costs in highly automated plants? How do activity-based costing systems deal with such a situation? (Think about the effect of automation on direct and indirect costs).
14. "Conventional product costing systems are likely to overcost high-volume products." Do you agree with this statement? Explain. (See items 2, 4 and 5 above and Chapter 4 item 12).
15. How are cost drivers selected in activity-based costing systems? (See MAAW's Textbook Chapter 7 discussion and the "Rule of One").
16. In activity-based costing, what are the trade-offs made in choosing among transaction, duration, and intensity activity cost drivers? (See item 6 above).
17. Why is practical capacity recommended in calculating activity cost driver rates? (See item 7 above and Chapter 4 summary item 4).
18. Why might an organization not experience financial improvement even after using activity-based costing to identify and take action on promising opportunities for process improvements and cost reductions?
19. "Activity-based costing systems yield more accurate product costs than conventional systems because they use more cost drivers to assign support costs to products." Do you agree with this statement? Explain.