Summary by James R. Martin, Ph.D., CMA
Professor
Emeritus, University of South Florida
Pricing Decisions Main Page |
Surveys Main Page
The purpose of this article is to provide a description of value analysis including an example based on a semi-trailer truck. Value analysis is part of the target costing methodology that is focused on cost at the design stage of a new product's development, and the product's value to the customer. The objective is to reduce the cost of product systems associated with functions that customers view as less desirable, and to increase the functionality and cost if necessary of product systems associated with functions that customers view as more desirable. This process requires an understanding of the product functions desired by customers, the relative importance of each function, and the relative cost of providing each of those functions.
Steps in the Value Analysis Process
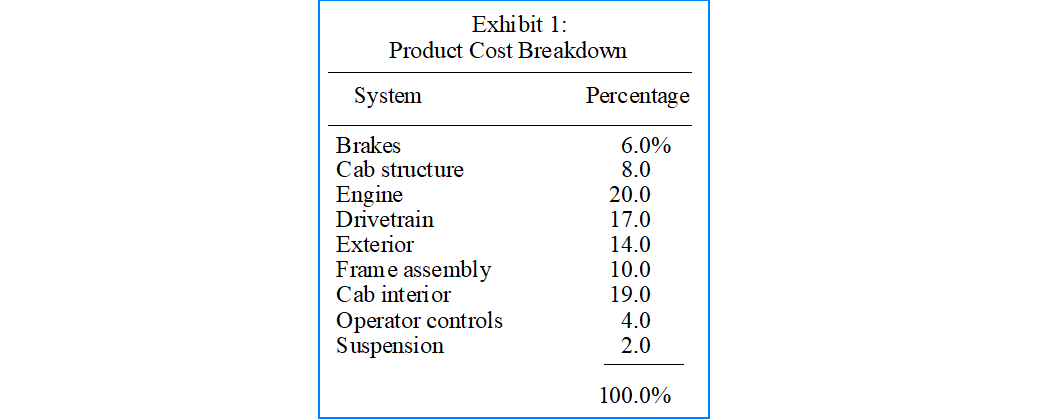
1. Product cost breakdown. Separate the product's cost into its major systems and assign a percentage of the total cost to each system. The authors' Exhibit 1 provides the cost breakdown for a semi-trailer truck.

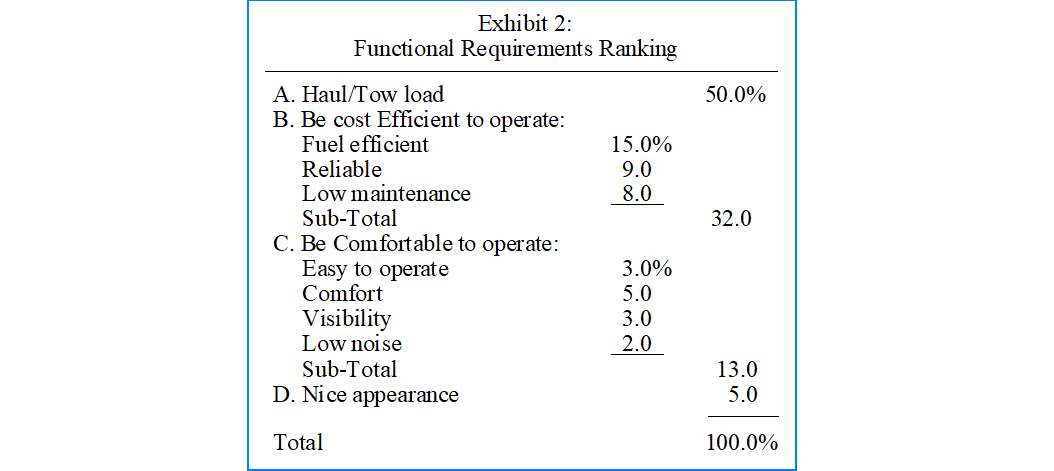
2. Identify the customer functional requirements from surveys or focus groups and rank them in terms of percentages. Exhibit 2 shows the truck's functional requirements and how they are ranked by customers. Note that haul/tow load and efficient operation are relatively more important than operating comfort or the appearance of the truck.
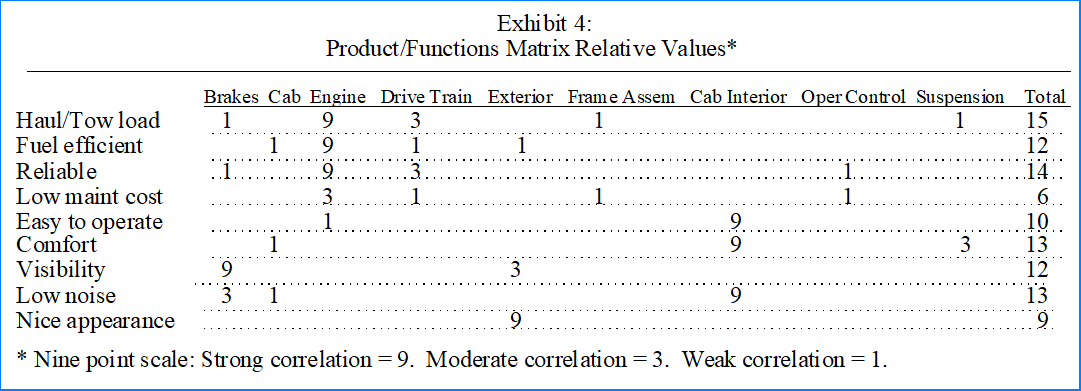
3. Develop a correlation matrix based on the correlations between the customer functional requirements and the product's major systems, and assign relative values to each system, i.e., where a strong correlation = 9, a moderate correlation = 3, and a weak correlation = 1. Exhibits 3 and 4 show how the various functions are related to the product's major systems, and the relative values (strong, moderate, weak) for each system. For example, the brakes have little to contribute to haul/tow load so they are assigned a weak relationship. I did not include Exhibit 3 because Exhibit 4 is identical to Exhibit 3 except the S, M, and W values are replaced by the 9, 3, and 1 values to represent strong, moderate, and weak.
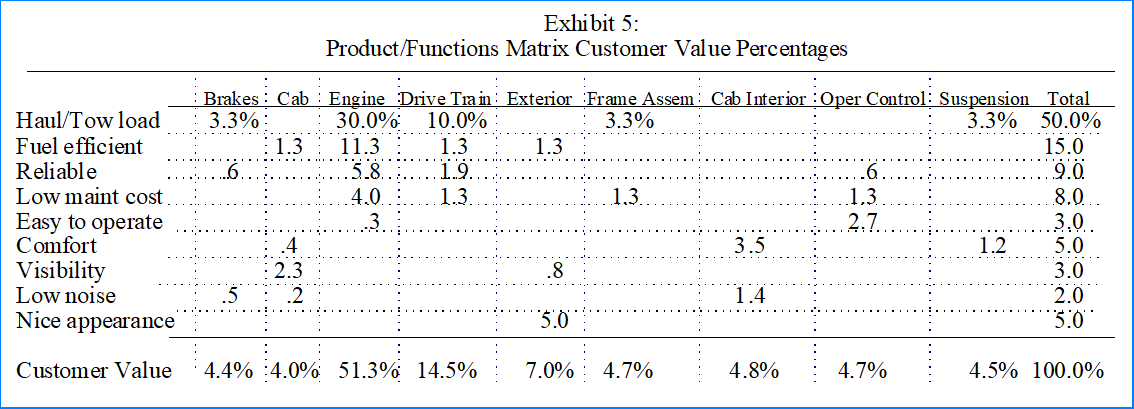
4. Develop a product/function customer relative value matrix where customer relative values for each feature are based on the customer functional requirements percentages multiplied by the value percentages based on the correlations. Exhibit 5 illustrates how the customer relative values are determined for the semi-trailer truck. For example, in the Haul/Tow row, Brakes are assigned 3.3% based on (1/15)(50%). The 1/15 is from the relative values in Exhibit 4 of 1/(1 for brakes +9 for engine +3 for drive-train +1 for frame assembly +1 for suspension). The brakes, frame assembly and suspension don't help much with hauling and towing, and the exterior, cab interior and operating controls have no effect on the trucks ability to haul and tow.
5. Create a value index for each major system where the Value index = Customer value score percentage for each system divided by the System's product cost percentage. The value index for the entire truck appears in Exhibit 6.
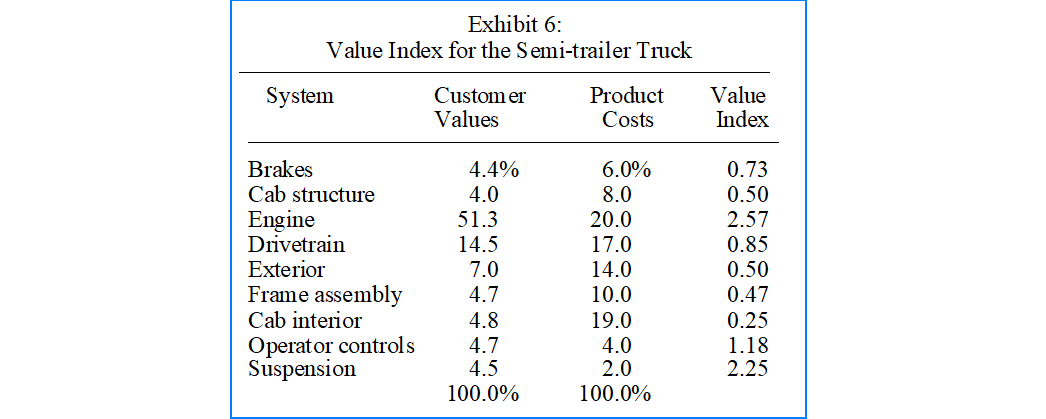
An index of less than one indicates that the customer value is below the system's cost and a cost reduction might be desirable. An index higher than one indicates the customer value is higher than the system's cost and the system is a candidate for an enhancement or upgrade. The graphic in Exhibit 7 shows which of the semi-trailer truck's systems are candidates for cost reduction, and which are candidates for additional investment.
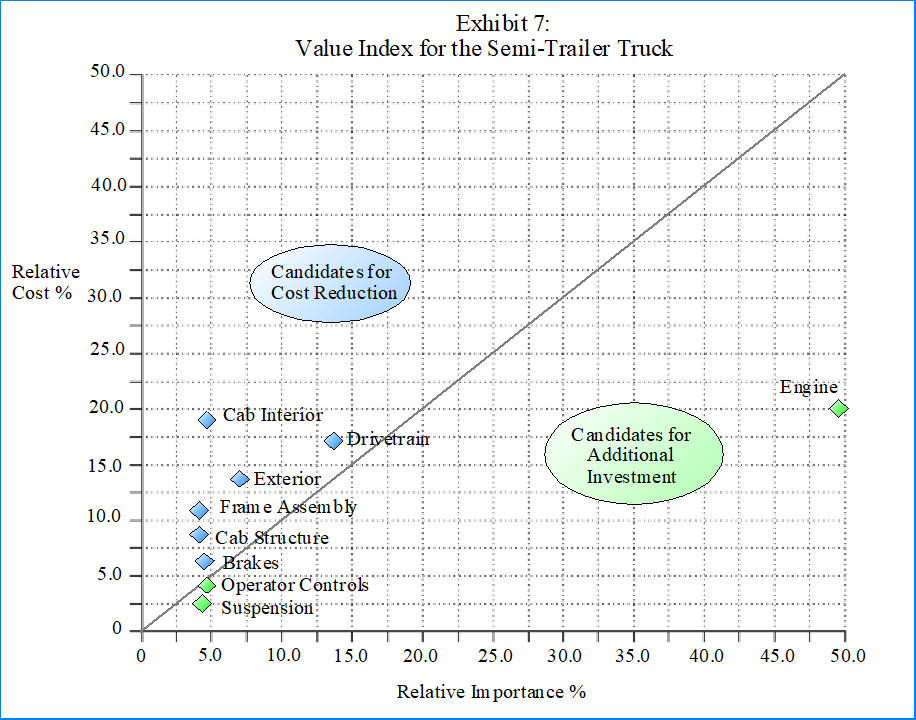
The authors continue with an illustration of how the cab interior could be examined for cost reduction, but their main point is that value analysis identifies opportunities to enhance the systems associated with functions that are more important to customers as well as opportunities to reduce the cost of the systems associated with functions that customers perceive as relatively unimportant.
________________________________________
Related summaries:
Berliner, C., and J. A. Brimson, eds. 1988. Cost Management for Today's Advanced Manufacturing: The CAMI Conceptual Design. Harvard Business School Press. See Chapter 1. (Long Summary).
Cokins, G. 2002. Integrating target costing and ABC. Journal of Cost Management (July/August): 13-22. (Summary).
Cooper, R. and R. Slagmulder. 2003. Interorganizational costing, Part 1. Cost Management (September/October): 14-21. (Summary).
Cooper, R. and R. Slagmulder. 2003. Interorganizational costing, Part 2. Cost Management (November/December): 12-24. (Summary).
Cooper, R. and R. Slagmulder. 2004. Achieving full-cycle cost management. MIT Sloan Management Review (Fall): 45-52. (Although the typical life cycle assumption is that 80-95% of a product's costs are locked in by design (See Chapter 2 of the CAM-I Conceptual Design), this study indicates that companies can substantially reduce costs throughout the product life cycle. The paper includes a discussion of five cost-management techniques: target costing, product-specific kaizen costing, general kaizen costing, functional group management, and product costing).
Hinterhuber, A. 2008. Customer value-based pricing strategies: Why companies resist. Journal of Business Strategy 29(4): 41-50. (Summary).
Hinterhuber, A. and S. Liozu. 2012. Is it time to rethink your pricing strategy? MIT Sloan Management Review (Summer): 69-77. (Summary).
Sakurai, M. 1989. Target costing and how to use it. Journal of Cost Management (Summer): 39-50. (Summary).
Schmelze, G., R. Geier and T. E. Buttross. 1996. Target costing at ITT Automotive. Management Accounting (December): 26-30. (Summary).
Tanaka, T. 1993. Target costing at Toyota. Journal of Cost Management (Spring): 4-11.
(Summary).