Summary by James R. Martin, Ph.D., CMA
Professor Emeritus, University of South Florida
ABM Main Page | AIS/MIS Main Page |
SPC Main Page
The purpose of this paper is to present an expanded perspective of performance analysis that includes the concepts of cost drivers, statistical variability and multiple database system views of performance. An additional objective is to provide an illustration of an integrated system that focuses on the deficiencies of traditional performance measurement systems and the potential for accounting system improvements.
The Statistical Concept of Variability
According to Deming, the main problem in management and leadership is the failure to understand the concept of variation. Effective management requires an understanding of the statistical concept of control (SPC). The SPC concept is based on the realization that variation will occur in any cost or process measurement. Control involves an evaluation to determine if the object to be controlled, such as a process measurement, is inside or outside an acceptable range, i.e., whether it is considered to be "in control," or "out of control." A process measurement (e.g., frequency, duration or physical) that is outside an acceptable range, is viewed as potentially out of control.
The SPC method has been used extensively in the area of quality control and extended (less successfully) to the area of cost control by accounting researchers. The method is applied by establishing a range based on upper and lower limits, rather than establishing a single point estimate as a measure of acceptable performance. These limits are based on the observed variability within a stable, (i.e., "in control") system.
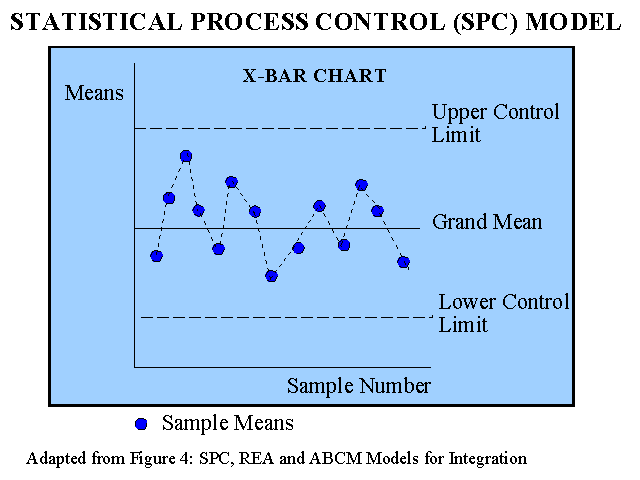
Initially, process sample means are plotted on a graph to determine if the system is stable before control limits are calculated. If the system is stable, or predictable, control limits are established using SPC techniques. The upper limit is determined by adding three standard deviations to the grand mean (i.e., the mean of the sample means). The lower limit is found in a similar manner by subtracting three standard deviations from the grand mean. Once the control limits have been determined, then sample means that fall within the limits are attributed to common, or random causes, while observations that are outside the control limits are attributed to special, or assignable causes. Common, or random causes are related to the system and are uncontrollable. The terms special, or assignable causes refer to something that causes the system measurement to move out of the predictable range.
Two types of errors can occur. One is where a variation resulting from a common cause is attributed to an assignable cause. The other type of error is where a variation resulting from an assignable cause is attributed to a common cause. The problem with the traditional cost variance methodology is the implication that all, or nearly all, cost variations have assignable causes. This is very misleading because most of the variations result from common causes associated with the system. Trying to correct common cause variation by blaming a worker or a lower level manager is counterproductive because the variation is not controllable.
Direct Material and Labor Cost Drivers and Variance Analysis
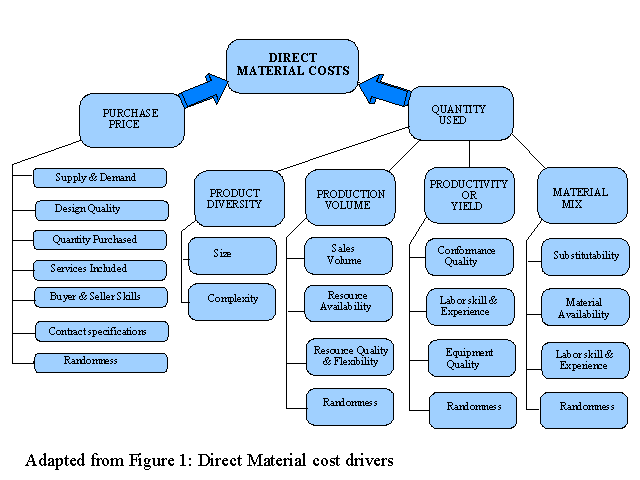
Conceptual views of direct material and direct labor cost drivers are presented in Figure 1. These illustrations show that prices and quantities drive materials and labor costs and that these prices and quantities are driven by many other factors. In addition, random variations in these factors are likely to cause a large percentage of the price and quantity fluctuations for both materials and labor.

Although the traditional cost variance methodology recognizes that prices and quantities drive materials and labor costs, the typical analysis does not reveal much beyond that level. Variance analysis does not provide any indication of whether common causes or assignable causes are responsible for the differences between actual and standard prices and quantities. Without an understanding of the normal variation created by the system, the user will not know when further investigation is warranted and tend to treat all variances as assignable. Without statistical process control information, managers are likely to blame workers for variations that are caused by the system. They also may confuse the correction of an assignable cause with an improvement in the system. However, the elimination of an assignable cause simply returns the system to a stable condition. An improvement in the system refers to a change in the characteristics of the system that either improves the mean outcome, or reduces the system variation.
Factory Overhead Cost Drivers and Variance Analysis
To understand the deficiencies of traditional overhead variance analysis, it is helpful to consider the conceptual view of factory overhead cost drivers presented in Figure 2. This figure shows that prices and quantities drive factory overhead, just like any other costs, and many other factors drive these prices and quantities, just like any other prices and quantities.
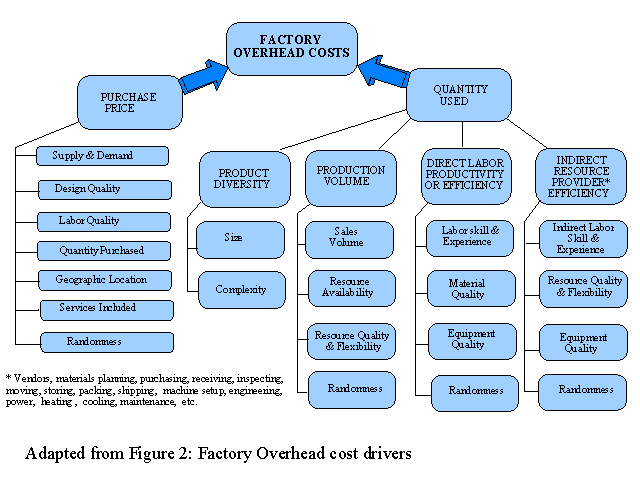
Although traditional overhead analysis includes a variety of alternatives for decomposing the total overhead variance, none of the alternatives involve isolating price and quantity variances. The variable overhead spending and efficiency variances that are illustrated in textbooks are not price and quantity variances in the same sense of the terms price and quantity used for direct materials and direct labor because the overhead rates are aggregates of many prices and quantities converted into a composite rate per activity measure. More specifically, the effects of product diversity and indirect resource provider efficiency are ignored by using a single production volume related allocation basis for all overhead costs.
In addition, an unavoidable estimating error distorts the spending and efficiency variances even when they are calculated for each type of indirect resource. The error occurs because the flexible budget used to separate the overhead variance into spending and efficiency variances includes an estimate of the indirect resource quantities, rather than the actual quantities as in the direct material and direct labor variance calculations. This estimate introduces a second type of variability into the analysis. The first type of variability refers to how the actual quantity of a resource varies around its own mean. The second type of variability refers to how the estimates in the flexible budget calculations vary around the actual quantities of the indirect resources used.
The variability in the relationship between the overhead allocation basis and indirect resource usage causes inevitable estimating errors in the flexible budget calculations. These errors cause the traditional overhead spending and efficiency variances to be meaningless. In addition, traditional overhead variances are likely to be misinterpreted as attributable to assignable causes and as many critics have argued, may promote excess and competition between interdependent departments and workers.
Systems Views of Cost Drivers
The third deficiency of cost variance analysis relates to the traditional view of the system from the perspective of the three narrow manufacturing cost categories (i.e., direct material, direct labor and factory overhead). This perspective ignores many of the interrelationships that are critical to decisions concerning products (e.g., pricing, mix and outsourcing) as well as decisions concerning reengineering and continuous improvement. Different views of the system are needed for different types of decisions. For example, while an activity-based cost perspective tends to be more useful for strategic decisions concerning products, connecting related costs is likely to provide more useful information for strategic decisions concerning system improvements.
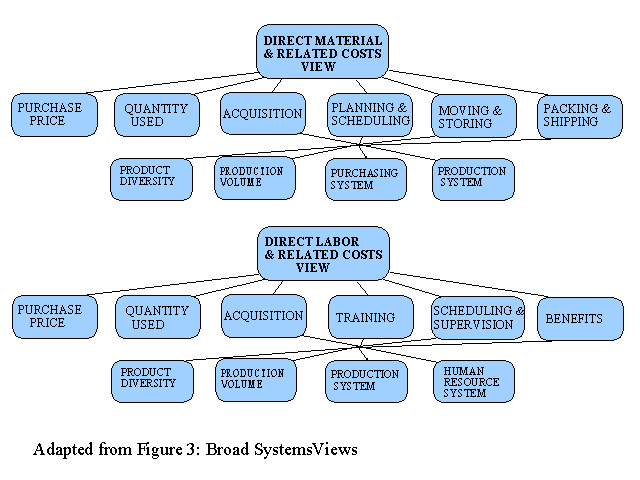
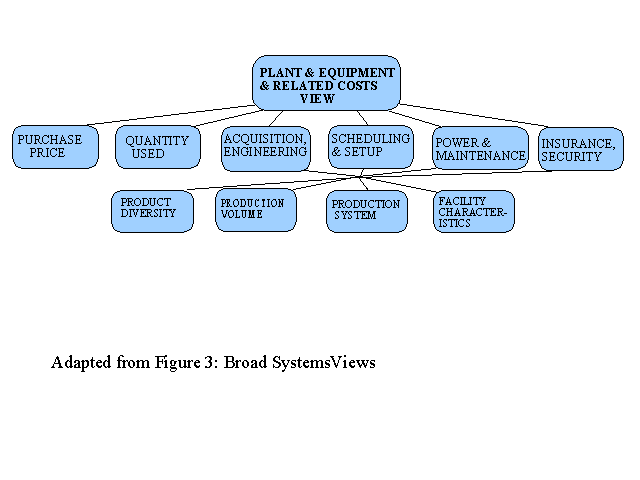
Consider the decision to change from traditional purchasing and production systems to just-in-time purchasing and production systems. Although the prices and quantities of direct materials and direct labor might not change significantly when JIT is implemented, reductions in related costs such as acquisition, training, planning, scheduling, moving and storing tend to substantially lower the overall costs. Figure 3 provides three related cost categories that are likely to be useful for analyzing the effects of these systems’ changes. The improvements in related costs would very likely be hidden in the offsets, distortions and aggregations of the traditional variance reports.
Additional perspectives include supplier, distribution channel and customer cost driver perspectives. These and many other holistic views of the system can be used to facilitate a bench marking initiative to discover potential improvements and opportunities for reengineering the entire system. Without a multiple systems view perspective, the interdependencies and potential improvements are hidden from management. The narrow functional views of direct material, direct labor and factory overhead costs within individual cost centers tends to motivate managers to optimize the parts in a misguided attempt to optimize the whole.
Recognition of the Need for a System Related Perspective
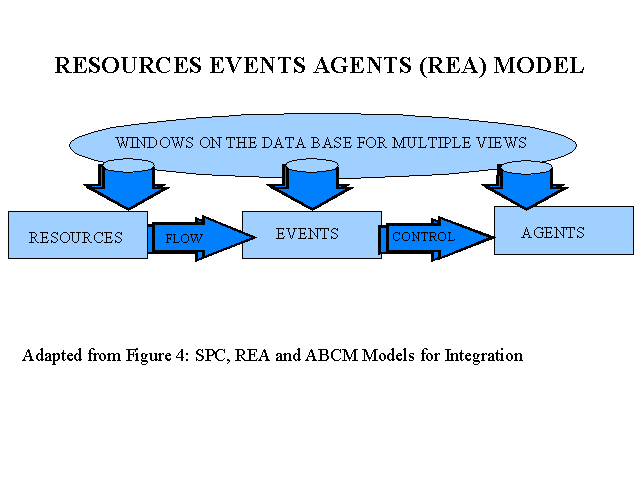
Although traditional cost variance analysis emphasizes a narrow functional view of performance, some accounting information systems (AIS) designers are emphasizing an event driven business process view of costs based on the Resources, Events, Agents (REA) database accounting model described by McCarthy in 1982. Briefly the REA approach captures the data associated with each event (e.g., preparing purchase orders, moving materials, interviewing job applicants, placing ads) including the resources involved (e.g., materials, labor, equipment, supplies, cash) and the agents who perform the activity or event (e.g., purchasing agents, materials handlers, various clerical workers).
According to the advocates of the REA model, this event driven approach to accounting systems design provides a framework for modeling business processes rather than simply modeling functions or departments. While the traditional cost variance analysis view tends to promote local, or subsystem optimization, the event-driven process view of costs promotes global, or system optimization.
Cost management systems (CMS) consultants and software designers also have recognized the need for a systems perspective. In two recent reviews of activity-based cost management (ABCM) software, several packages are described that provide horizontal process views of costs across departmental boundaries (see Figure 3 for the same idea). These ABCM software packages were developed from the underlying database system concept advocated in the CAM-I conceptual design. The concept is essentially to capture the system data only once and then use it to create many different types of information as needed. These developments in accounting practice provide additional support for the contention that management accounting education should be redesigned around the database system concept.
A Multiple View Database System
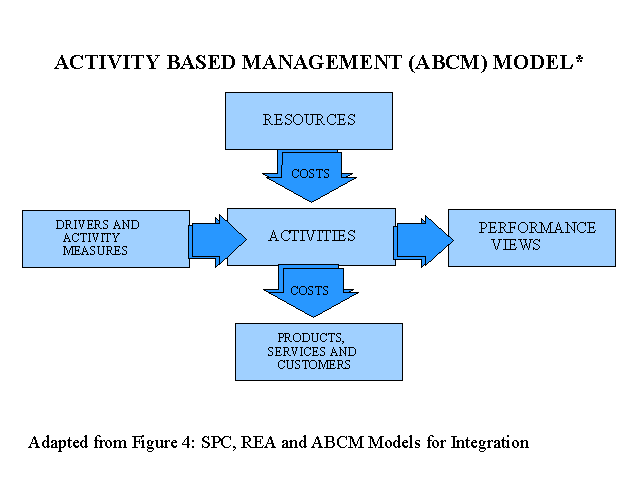
Integrating the SPC, REA and ABCM models provides the potential for developing a multiple view database system to serve a variety of users. These three models are illustrated in Figure 4 to help facilitate their integration in Figure 5. The SPC model in the top section of Figure 4 is useful at the operator level where sample means of critical frequency, duration or physical measurements are calculated and plotted to monitor the stability of a process. The REA database model, in the middle of Figure 4, provides the foundation for a system to capture the resources, agents and other information associated with each event as it occurs. The section at the bottom of Figure 4 illustrates the ABCM model. The vertical view of the model reflects the basic ABC concept that products, services and customers consume activities that consume resources. Resources cause costs that are traced to products, services and customers through activities. The horizontal view adds the concept that drivers cause activities and these "cause and effect" relationships provide the basis for a variety of performance views of the system. The ABCM model provides information to support strategic decisions such as whether to produce or discontinue products, how to price products and whether to produce or outsource product components.
Each of these three models captures more detailed disaggregated data than the traditional performance analysis model, but as indicated above, each model has a different purpose. Therefore, these models need to be integrated, as in Figure 5, to form a database system with multiple views of disaggregated entity data. With this type of integrated system, analysts do not need to decompose highly aggregated financial information into a variety of less useful variances.
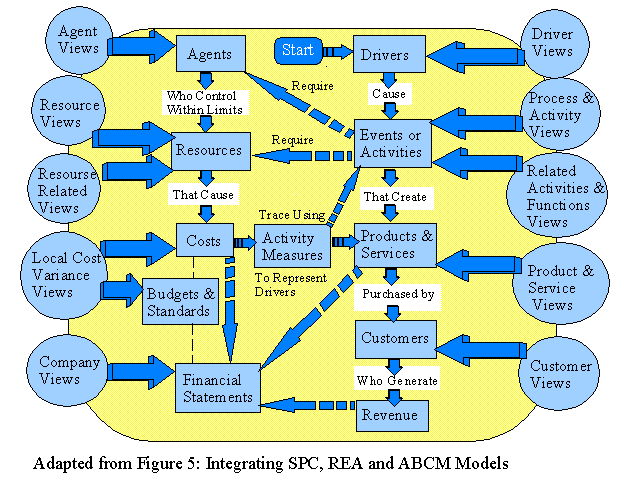
As Figure 5 shows, drivers cause events or activities that create products and services. These events or activities require resources and agents who use the SPC technique for control within the limits of the system. The resources cause costs that are traced to products and services using activity measurements to represent the associated activity drivers. The integrated model supports traditional budgets and standards, (if desired) as well as general purpose financial statements. The integration of the SPC, REA and ABCM concepts provides a system with "dynamic windows on the data-base" (McCarthy's term) for users to analyze the company from various local and global perspectives including driver relationships, processes, activities, products, services, customers, agents, resources and many combinations of these entities. This integrated model has the potential to overcome the deficiencies of the traditional management accounting system.
Conclusion
Traditional accounting cost variance analysis has been criticized for supporting a narrow view of cost drivers and ignoring the concepts of statistical variation and system interrelationships. Although variance analysis is presented in textbooks and training manuals as a control system, effective control requires an understanding of the drivers involved and the variation within the system, as well as the interdependencies and relationships with other parts of the system. Expanding the perspective of performance analysis to include the concepts of cost drivers, statistical variation and system interrelationships allows the system to communicate more effectively with those who need information to plan, measure and continuously improve performance. This enhanced communication facilitates an understanding of the cause and effect relationships, system variability and subsystem linkages that are needed before potential improvements can be discovered and implemented.
In spite of the progress made by AIS and CMS systems designers, most cost and managerial accounting textbook illustrations of performance analysis appear to be stuck in a traditional variance analysis tar pit. Numerous critics have indicated a need to change from what Kaplan referred to as the academic management accounting (AMA) emphasis on isolated cost analysis issues, to the organizational management accounting (OMA) emphasis on holistic system design issues. It is clear that the traditional accounting variance methodology should not be taught without reference to the deficiencies described in this paper and elsewhere. Perhaps the criticisms of traditional variance analysis should be introduced to students as controversial issues (See Martin 1994), but they should not be ignored. In addition, the concepts of activity drivers and statistical variation should be prerequisites. Otherwise, thousands of accounting graduates will continue to enter the business world with a narrow and distorted view of how to measure, control and improve a system.
_________________________________________________
Related summaries:
Albright, T. L. and H. Roth. 1993. Controlling quality on a multidimensional level. Journal of Cost Management (Spring): 29-37. (Summary).
Cooper, R. 1990. Implementing an activity-based cost system. Journal of Cost Management (Spring): 33-42. (Summary).
Cooper, R. 1996. Activity-based management and the lean enterprise. Journal of Cost Management (Winter): 6-14. (Summary).
Cooper, R. and R. S. Kaplan. 1992. Activity-based systems: Measuring the costs of resource usage. Accounting Horizons (September): 1-13. (Summary).
Deming, W. E. 1993. The New Economics For Industry, Government & Education. Cambridge: Massachusetts Institute of Technology Center for Advanced Engineering Study. (Summary).
Martin, J. R. Not dated. Activity based management models. Management And Accounting Web. ABM Models
Martin, J. R. Not dated. The CAM-I conceptual design. Chapters 1-3. Management And Accounting Web. (Summary).
Martin, J. R. Not dated. The CAM-I conceptual design. Chapter 6. Management And Accounting Web. (Summary).
Martin, J. R. Not dated. What is Six Sigma? Management And Accounting Web. Six Sigma Summary
Martin, J. R. 1994. A controversial-issues approach to enhance management accounting education. Journal of Accounting Education 12(1): 59-75. (Summary).