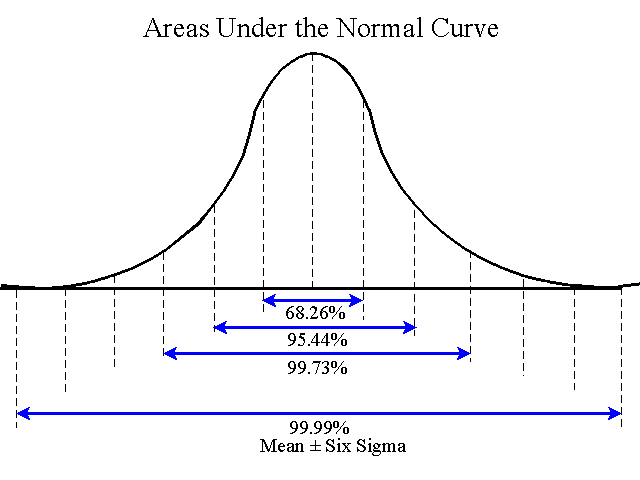
Provided by James R. Martin, Ph.D., CMA
Professor Emeritus, University of South Florida
Quality Related Main Page |
SPC Main Page
Six Sigma is a continuous improvement methodology developed at Motorola that is designed to systematically reduce defects recognizing two important relationships. 1
1. The overall yield of a group of related processes is much lower than the yields of the individual processes. For example, if the individual yields at each of a set of dependent processes is .99, the overall yield for 100 processes or operations would be .99100 = .366.
2. The total cost of a product or service is directly related to the defect rate, i.e., Total cost = (Unit cost)(1+ defect rate).
The six sigma level is where the performance at each function, process, or operation is nearly perfect, generating a defect rate of .000034% or only 3.4 defects per million. For comparison, a three sigma level of performance generates 66,807 defects per million as indicated in the table below.
| Sigma* | Defects per million | Long term yield % |
| 3 | 66,807 | 93.32 |
| 4 | 6,21 | 99.379 |
| 5 | 233 | 99.9767 |
| 6 | 3.4 | 99.999966 |
| *A sigma is a statistical unit of measure referred to as the standard deviation. | ||

Steps in the Six Sigma Methodology
The six sigma methodology includes the following five steps.
1. Define the business.
This step includes defining customer requirements, business goals and objectives, team roles and responsibilities, scope and resources, processes, and performance baselines.
For example, Noritaki Kano's quality analysis is useful in defining the customer's requirements. Kano's
approach separates customer requirements into three categories:
Assumed requirements - a given feature or function such as wheels on a automobile.
Specified requirements - the customer's explicitly stated requirements.
Expected requirements - the customer's unstated, but real expectations.
These requirements establish how good work and defective work are defined. Other techniques used in this step include: project charter, stakeholder commitment analysis, affinity diagrams, voice of the customer, force field analysis, Pareto analysis, process mapping, and SIPOC (suppliers, inputs, process, outputs, customers).
2. Measure the processes.
Measure defects per unit, defects per million opportunities and the yield percentage. For example,
Defects per unit = Total number of defects ÷ Total number of units inspected
A unit is the output of a process, e.g., an invoice in accounts payable, a subassembly in an assembly area, a package in a packing department. All defects are counted, not just the number of defective units since a unit may include several defects.
3. Analyze
the process to determine the root cause.
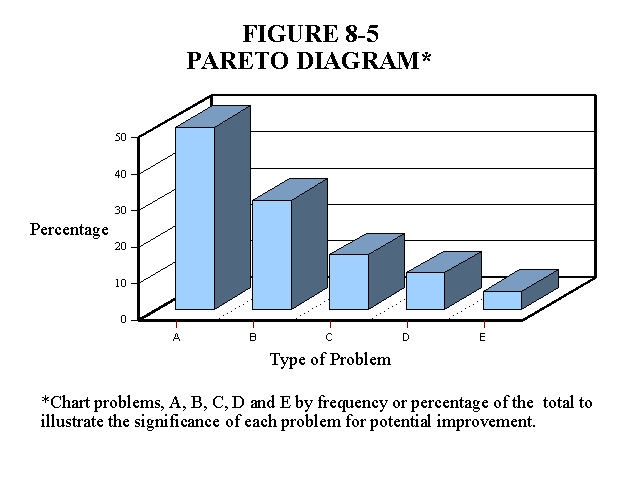
Pareto charts or diagrams are used in this step to identify critical factors that have the greatest
influence on performance, recognizing that most problems are created by a few causes
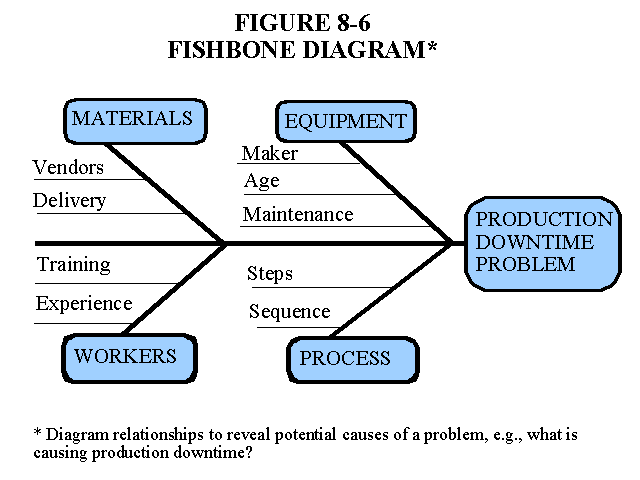
(Referred to as the 80/20 rule). The analyze step continues with cause and effect, or fishbone diagrams
to identify potential causes of problems. Other techniques used in this step include
multivary analysis and failure mode and effects analysis. The illustrations below are
from MAAW's Textbook Chapter 8.
4. Improve the process.
This step includes use of two techniques, Design of Experiments and change management.
Design of experiments involves statistically designed experiments where multiple measurements are made of two or more variables are that vary simultaneously. This allows the interactions between many variables to be included in the experiment. After the experiment is designed, data are collected and analyzed with statistical software
5.
Control.
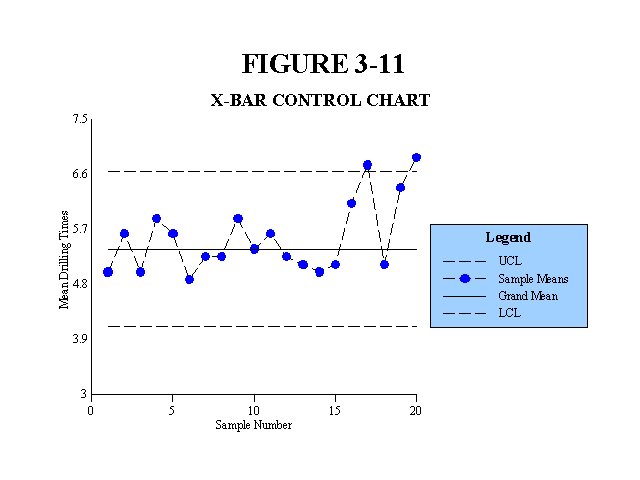
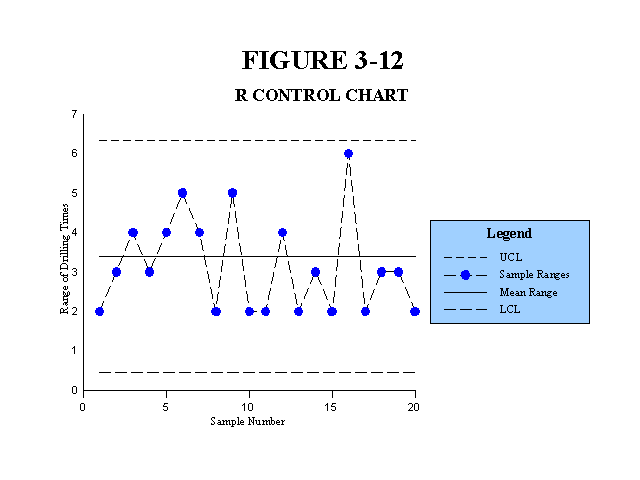
Control tools include control charts, precontrol charts, and run charts. The charts below are from
MAAW's Textbook Chapter 3. This step
includes transforming and maintaining an organizational culture that embraces change and
improvement.
Six Sigma DMAIC Roadmap
A somewhat different and more detailed list of steps and tools is provided in the tables below. These tables were adapted from the article "Six Sigma DMAIC Roadmap" found on the Six Sigma web site.
| Define | |
| Steps | Tools |
| Define customers and requirements. | Project charter |
| Develop problem statement, goals and benefits. | Process flowchart |
| Identify champion, process owner and team. | SIPOC diagram |
| Define resources. | Stakeholder analysis |
| Evaluate key organizational support. | DMAIC work breakdown ... |
| Develop project plan and milestones. | CTQ definitions |
| Develop high level process map. | Voice of the customer ... |
| Measure | |
| Steps | Tools |
| Define defect, opportunity, unit and metrics. | Process flowchart |
| Detailed process map of appropriate areas. | Data collection plan/example |
| Develop data collection plan. | Benchmarking |
| Validate the measurement system. | Measurement system analysis |
| Collect the data. | Voice of the customer ... |
| Begin developing Y=f(x) relationship. | Process sigma calculation |
| Determine process capability & sigma baseline. | |
| Analyze | |
| Steps | Tools |
| Define performance objectives. | Histogram |
| Identify value/non-value added process steps. | Pareto chart |
| Identify sources of variation. | Time series/run chart |
| Determine root cause or causes. | Scatter plot |
| Determine vital few x's, Y=f(x) relationship. | Regression analysis Cause and effect/fishbone diagram 5 whys Process map review and ... Statistical analysis Hypothesis testing Non-normal data analysis |
| Improve | |
| Steps | Tools |
| Perform design of experiments. | Brainstorming |
| Develop potential solutions. | Mistake proofing |
| Define operating tolerances of potential system. | Design of experiments |
| Assess failure modes of potential solutions. | Pugh matrix |
| Validate potential improvement by pilot studies. | House of quality |
| Correct/re-evaluate potential solution. | Failure modes and effects ... Simulation software |
| Control | |
| Steps | Tools |
| Define and validate monitoring and control system. | Process sigma calculation |
| Develop standards and procedures. | Control charts |
| Implement statistical process control. | Cost savings calculations |
| Determine process capability. | Control plan |
| Develop transfer plan, handoff to process owner. | |
| Verify benefits, cost savings/avoidance, profit growth. | |
| Close project, finalize documentation. | |
| Communicate to business, celebrate. | |
For more on six sigma and General Electric's experience using the technique, see the Lucier & Seshadri Summary.
Questions
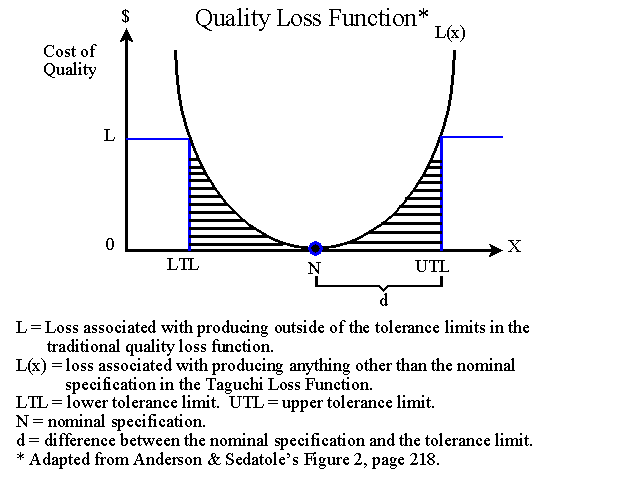
1. Does the six sigma methodology support Juran's approach or Deming's approach to quality? The graphic below is from the constrained optimization summary.
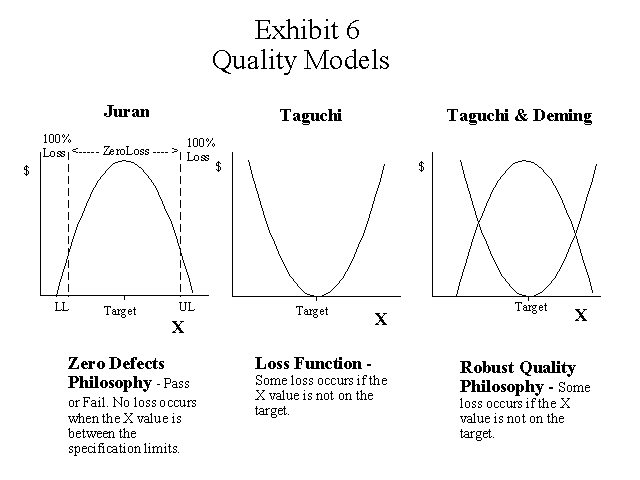
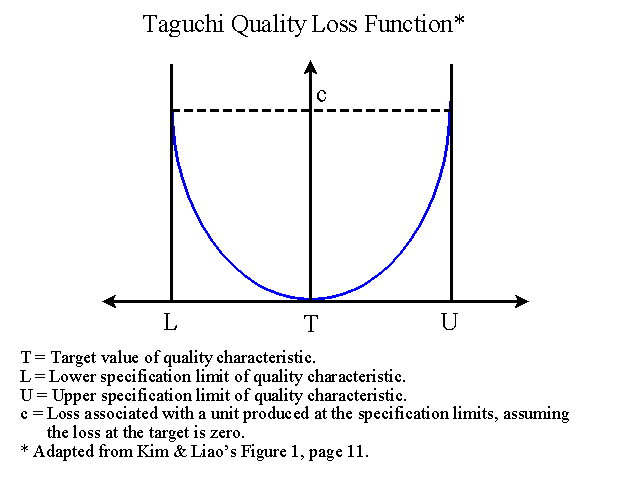
Taguchi's and Deming's view is that loss occurs anywhere away form point T in the graphic below.
The next graphic shows the Zero Defect Goalpost approach to quality. See the Albrignt and Roth Summary for more information.
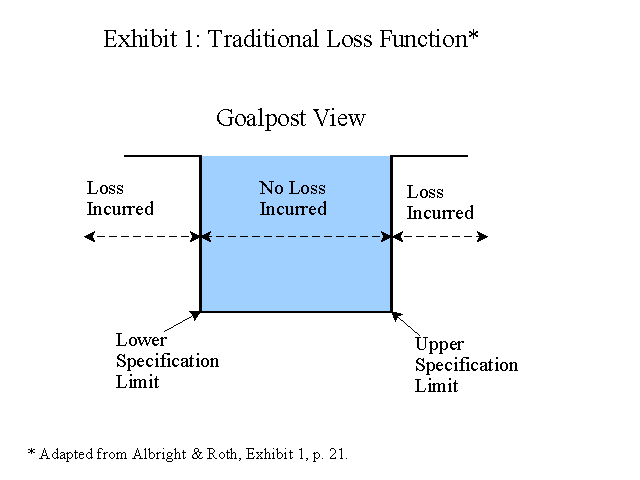
Comparing the Zero Defect Goal Post approach with Taguchi's and Deming's approach.
2. Does the answer to the question above depend on how defects and defective work are defined in the six sigma approach? Discuss.
______________________________________________________
1 Most of this summary is based on Chapter 2 of Gupta, P. 2004. Six Sigma Business Scorecard: Creating a Comprehensive Corporate Performance Measurement System, and the Six Sigma DMAIC Roadmap from the Six Sigma web site. The graphic illustrations are from MAAW's Chapters and summaries as indicated above.
Related Chapters and summaries:
Deming, W. E. 1993. The New Economics for Industry For Industry, Government & Education. Cambridge: Massachusetts Institute of Technology Center for Advanced Engineering Study. (Deming discusses the concept of variation in several chapters, particularly 8 and 10. (Summary).
Holmes, D. S. and R. E. Hurley. 2003. How SPC enhances budgeting and standard costing - Another look. Management Accounting Quarterly (Fall): 57-62. (Summary).
Lucier, G. T. and S. Seshadri. 2001. GE takes six sigma beyond the bottom line. Strategic Finance (May): 40-46. (Summary).
Martin, J. R. Not dated. Chapter 3: Cost Behavior Analysis & Statistical Process Control - Part II. Management Accounting: Concepts, Techniques & Controversial Issues. Management And Accounting Web. Chapter3PartII
Martin, J. R. Not dated. Chapter 8: Just-In-Time, Theory of Constraints, and Activity Based Management Concepts and Techniques. Management Accounting: Concepts, Techniques & Controversial Issues. Management And Accounting Web. Chapter8
Martin, J. R. 1998. Expanding the perspective of performance analysis to include the concepts of SPC, ABCM and REA database systems. Advances in Accounting Education (1): 25-41. (Summary).
Nolan T. W. and L. P. Provost. 1990. Understanding variation. Quality Progress (May): 70-78. (Summary).
Reeve, J. M., and J. W. Philpot. 1988. Applications of statistical process control for financial management. Journal of Cost Management (Fall): 33-40. (Summary).
Reeve, J. M. 1989. The impact of variation on operating system performance. Proceedings of the Third Annual Management Accounting Symposium. Sarasota: American Accounting Association: 75-89. (Summary).
Roehm, H. A., L. Weinstein, and J. F. Castellano. 2000. Management control systems: How SPC enhances budgeting and standard costing. Management Accounting Quarterly (Fall): 34-40. (Summary).
Roth, H. P. and T. L. Albright. 1994. What are the costs of variability? Management Accounting (June): 51- 55. (Summary).
Walter, R., M. Higgins and H. Roth. 1990. Applications of control charts. The CPA Journal (April): 90-93, 95. (Summary).
See MAAW's Six Sigma Bibliography for more articles and books.