Provided by James R. Martin, Ph.D., CMA
Professor Emeritus, University of South Florida
TOC Main
Page | TOC Problems Main Page
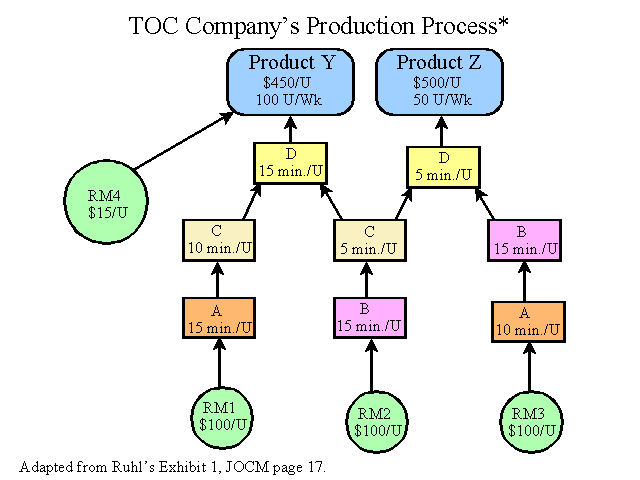
TOC Company produces two products, Y and Z that are processed in four departments, A, B, C and D. Product Y requires three types of materials, M1, M2 and M4. Product Z requires two types of materials, M2 and M3. The company's production process is illustrated in the following graphic adapted from Ruhl's Exhibit 1.
The requirements for each product are summarized in the table below.
| Resource | Required per unit of Product Y |
Required per unit of Product Z |
| Material 1 | $100 | - |
| Material 2 | $100 | $100 |
| Material 3 | - | $100 |
| Material 4 | $15 | - |
| Department A | 15 minutes | 10 minutes |
| Department B | 15 minutes | 30 minutes |
| Department C | 15 minutes | 5 minutes |
| Department D | 15 minutes | 5 minutes |
Each department has 2,400 minutes of available time per week. The Company's operating expenses are $30,000 per week. Based on current demand, the company can sell 100 units of product Y and 50 units of product Z per week. Sales prices are $450 for product Y and $500 for product Z. All four materials are available in sufficient quantities. The needed workers are also available.
Required:
1. Determine the company's constraint.
2. Determine the throughput per unit for each product.
3. Determine the throughput per minute of the constrained resource for each product.
4. Determine the product mix needed to maximize throughput, i.e., the number of units of Y and Z that should be produced per week.
5. Determine the maximum net income per week for TOC Company.
6. Suppose the company broke the current constraint by doubling the capacity of that resource. What would become the new constraint?
Solution
The following approach is useful when there are only two products and there is only one binding constraint in addition to demand. However, a different approach is needed when there are overlapping constraints, i.e., more than one binding constraint. Linear programming is needed to solve the more difficult problems involving multiple products with multiple binding constraints.
1. Determine the company's constraint.
Time requirements to meet demand for each department are calculated as follows:
| Department | Product Y | Product Z | Total
Time Required Per Week |
| A | (15 min)(100 units) | (10 min)(50 units) | 2,000 minutes |
| B | (15 min)(100 units) | (30 min)(50 units) | 3,000 minutes |
| C | (15 min)(100 units) | (5 min)(50 units) | 1,750 minutes |
| D | (15 min)(100 units) | (5 min)(50 units) | 1,750 minutes |
Each machine center has only 2,400 minutes of available time per week. B is the constraint because it does not have enough capacity to process 100 units of Y and 50 units of Z per week.
2. Determine the throughput per unit for each product.
Throughput per unit for each product is needed so that we can determine how to use the constraint to maximize throughput. Throughput per unit is as follows:
| Product | Sales price - Materials Cost | Throughput Per Unit |
| Y | $450 - 215 | $235 |
| Z | $500 - 200 | $300 |
3. Determine the throughput per minute of the constrained resource for each product.
| Product | Throughput Per Unit Minutes required in B |
Throughput Per Minute |
| Y | $235 ÷ 15 | $15.67 |
| Z | $300 ÷ 30 | $10.00 |
4. Determine the product mix needed to maximize throughput, i.e., the number of units of Y and Z that should be produced per week.
Maximizing throughput requires producing as much of the product with the highest throughput per minute of the constrained resource as needed to meet demand. So the company should produce 100 units of product Y. This requires (100 units)(15 minutes) = 1,500 minutes of time in the constraint department B and leaves 2,400 - 1,500 = 900 minutes for the production of 30 units of product Z, i.e., 900 minutes ÷ 30 minutes per unit = 30 units of Z.
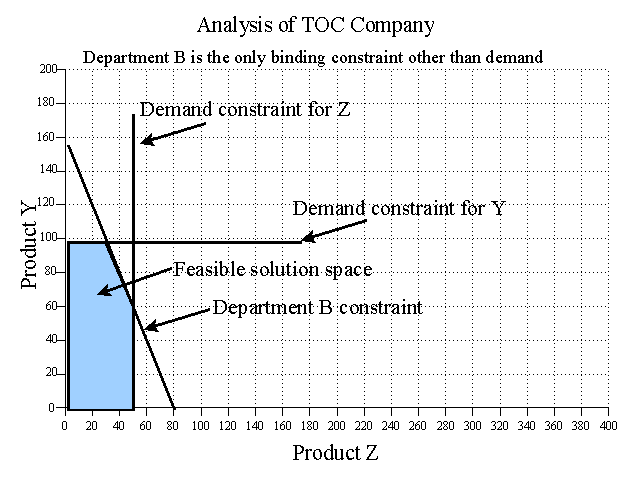
Graphic Analysis
The following graphic analysis provides a general approach for solving simple product mix problems that is also applicable when there are overlapping constraints.
First, plot the constraints to find the feasible solution space. The B constraint is 15Y + 30Z = 2,400 so Department B could produce 160 Y's (i.e., 2,400/15) or 80 Z's (i.e., 2,400/30), or some combination of Y and Z indicated by the constraint line connecting those two points on the graph. The department B constraint and demand constraints define the feasible solution space indicated by the mustard colored area on the graph.
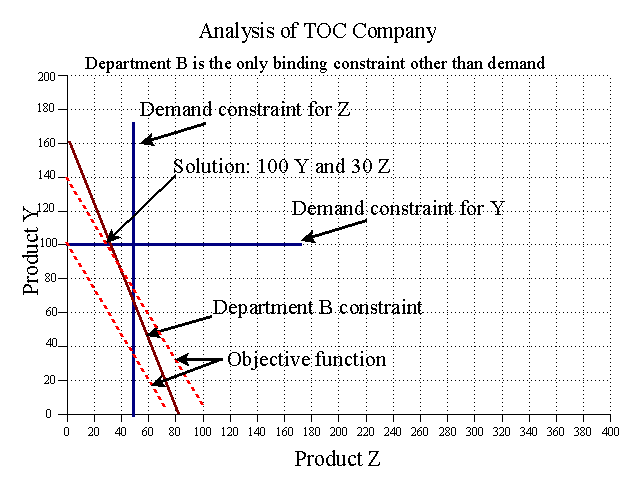
2. Check the solution at each corner point, or plot the objective function and move it to the right as far as possible in the feasible solution space. The objective function is to maximize throughput where Throughput = 235Y + 300Z. Checking the corner points we find that 100 Y and 30 Z provides the greatest amount of throughput.
| Corner Point | Throughput |
| 100 Y and zero Z | (100)(235) = 23,500 |
| 100 Y and 30 Z | (100)(235) + (30)(300) = 32,500 |
| 60 Y and 50 Z | (60)(235) + (50)(300) = 29,100 |
| Zero Y and 50 Z | 0 + (50)(300) = 15,000 |
If we plot the objective function 235/300 (i.e., it takes .7833 of a Z to produce as much throughput as 1 Y), we can locate the solution by moving it to the outer most point in the feasible solution space as illustrated below. The first objective function shows that 100 Ys would produce the same throughput as 78.3333 Zs. This is an iso-throughput line indicating that any point on the line represents a combination of Y and Z that produces $23,500 of throughput. The point indicated by 100 Y and 30 Z is the last point the objective function touches in the feasible solution space as we move it up and to the right. This point indicates the solution to our product mix problem.
5. Determine the maximum net income per week for TOC Company.
| Sales: | ||
| 100 units of Y = (100)($450) | $45,000 | |
| 30 units of Z = (30)($500) | 15,000 | $60,000 |
| COGS: | ||
| 100 units of Y = (100)($215) | $21,500 | |
| 30 units of Z = (30)($200) | 6,000 | 27,500 |
| Throughput | 32,500 | |
| Less Operating expense | 30,000 | |
| Net income | $2,500 |
Note: An assumption in this illustration is that there are no beginning or ending inventories of work in process or finished goods. See the Pop Company problem for an illustration with beginning and ending inventories.
6. Suppose the company broke the current constraint by doubling the capacity of that resource. What would become the new constraint?
Doubling the capacity of Department B would allow the company to produce 60 units of product Z in addition to the 100 units of product Y. Since only 50 units of Z are demanded, the company would have unused capacity in all departments. Therefore, external demand would become the constraint. Of course the new solution would be at the intersection of the demand constraints, i.e., 100 Ys and 50 Zs.
See TOC Class Problem 2 for an illustration with overlapping constraints.
__________________________________________________
*Ruhl, J. M. 1997. The Theory of Constraints within a cost management framework. Journal of Cost Management (November/December): 16-24. Ruhl's illustration is based on an example discussed by Goldratt in Chapters 12 and 13 of The Haystack Syndrome.
Related problems and summaries:
See Goldratt, E. M. 1990. The Haystack Syndrome: Sifting Information Out of the Data Ocean. New York: North River Press. (Summary).
Martin, J. R. Not dated. TOC Problem 2: Determine the optimum product mix with overlapping constraints. Management And Accounting Web. TOCClassProblem2.htm
Martin, J. R. Not dated. TOC Problem 3: Determine the optimum product mix with overlapping constraints. Management And Accounting Web. TOCClassProblem3.htm