Summary by Eileen Fried
Master of Accountancy Program
University of South Florida, Summer 2003
ABM Main Page | Cost
Management Main Page | Continuous Improvement Main Page
Originally, activity-based costing (ABC) was designed for long term strategic decisions about products and customers. In this article, Greenwood and Reeve propose a framework to help with operational decision making. “The principle objective of an activity-based management system must be to reveal the details about the cost of process activities.”
Current Limitations of ABC
The authors note the following limitations of current ABC models for operational decisions:
Promoting Continuous Improvement - Several publications present ABC information as a tool to promote process improvement, but don’t provide a “comprehensive methodology…designed to relate cost and performance to processes at the activity level”. Labeling an activity as value-add or non-value-add does not provide any basis or guidance for improving the operation.
Process Cost Visibility - Instead of associating activity costs with a business process, the costs are pooled by an identified cost driver. Visibility into the process cost is lost, making it difficult to manage and measure continuous improvement of the process.
Cost Simulation Capability – Current methodologies are “reactive” in design and limited at best. There is not a clear correlation as to what drives a change in the cost.
Process-based Activity Architecture
Greenwood and Reeve, look to address these limitations of ABC by providing a framework that takes the techniques of ABC, but instead of pooling activity costs by cost drivers, the activity costs are pooled by business process. This allows for the preservation of the process cost which can then be better controlled by management and used as a basis for measuring continuous improvement within the process. The architecture is also designed to collect or maintain costs at the organizational unit level and looks at the cost behavior patterns of the different resources employed in the activities. This allows for better cost simulation data for changes in product design or production scenarios and the impact of these changes on the organization.
Example
It is easier to understand the framework through some of the examples/exhibits presented in the article based on a fan coil manufacturing company.
Key Terms and Concepts for the Activity Architecture
Below is an explanation of the key terms used to describe the activity cost collection framework.
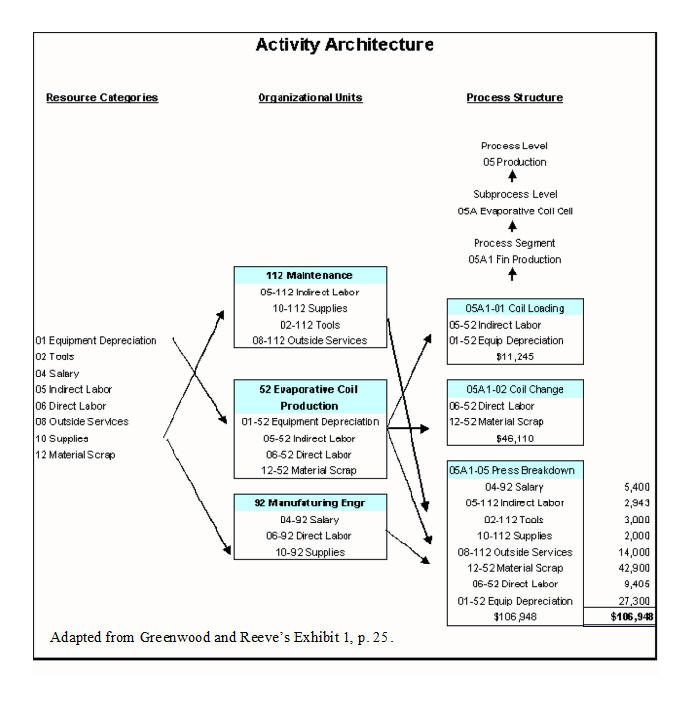
Resource categories – budgetary line item costs in the organization (GL expense accounts) aggregated into major categories of cost. Example – supplies, direct labor, indirect labor, material scrap, equipment depreciation
Organizational Units – functional departments, such as Maintenance, Evaporative Coil Production and Manufacturing Engineering. The resource categories are collected by organizational unit; costs are identified to specific departments.
Process Hierarchy – the company is viewed as a hierarchy of embedded processes and sub processes, like a work breakdown structure or outline. Example:
| Hierarchy | Process | |
| 05 | Process level | Production |
| 05A | Sub process level | Evaporative coil cell |
| 05A1 | Production process segment | Fin production |
| 05A1-01 | Activity | Coil loading |
| 05A1-02 | Activity | Coil change |
| 05A1-05 | Activity | Press breakdown |
Activity is the lowest level of the hierarchy and the point where cost is captured. Each “activity” uses a combination of resource categories from various organizational units to complete their task. These activity costs can then be consolidated at the higher levels of the process hierarchy. This provides cross functional information to the product manager about what it is costing to perform an activity, as well as to the organizational unit managers about where there resources are being used.
Consumption basis – the basis on which cost within the resource category is consumed by an activity. An example would be full-time equivalent (FTEs) for labor.
Exhibit 1 shows the relationship between the resource categories, organizational units and process hierarchy and how you capture the activity cost by organizational unit/resource category. The costs associated with activity 05A1-05 Press breakdown have been determined by using a consumption basis applied to each organizational unit/resource category. Through this you have a clear picture of the major cost contributors and can look to these areas for cost reduction.
Activity Hierarchies
Along with cost information, each activity is also categorized by frequency and hierarchy. These are a further breakdown of activities that define the nature of the activity and help you measure and set performance objectives:
Frequency – how often the activity occurs. 1 of 4 categories
Unit – Activity performed once per unit
Batch – Activity performed once per batch
Routine – Activities performed routinely to sustain a product or process, from both normal operations and exceptional events (a.k.a. cost drivers)
Product Life Cycle – Activities performed at given points during the life cycle of a given product.
Hierarchy – an activity can be related to one of 3 hierarchies
Process – as in Exhibit 1
Product - Part numbers/ingredients - Products - Product families
Customer – Order line - Orders - Individual customers - Channels - Territories
Understanding the nature of routine activities that trigger subsequent activities is very helpful to management. These triggering activities become cost drivers. Examples would be defective material, material shortages, returned goods. These activities set off a whole other set of activities that can now be evaluated and attacked from a cost perspective.
Product Costing
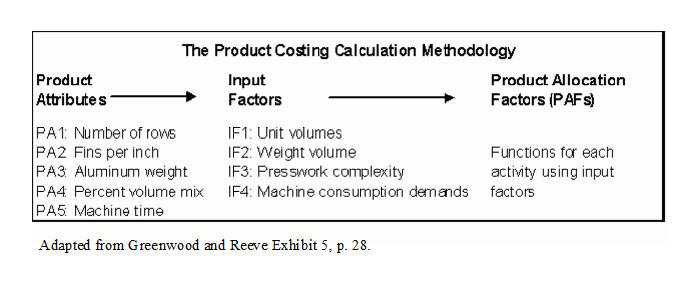
For product costing, the authors suggest a “multi-driver” perspective based on product attributes (PAs). The amount of resources consumed in both production and non-production processes are related to the PAs. These attributes are then used mathematically to create input factors (IFs), which in turn are then used to calculate product allocation factors or PAFs. The PAFs are functions developed by engineers who can equate the relationship between a products attributes and the production activity. After the PAF is determined, we can take our activity costs (as developed in Exhibit 1) and multiple it by the PAF for our particular product to get the product cost.
As a process is improved or a product is redesigned, the attributes and resulting PAFs would be adjusted.
Process Cost Modeling and Planning
In order to help managers determine the effects of changes in spending patterns and resource allocations through out the organization, “a model must be able to simulate resource levels as a result of process improvement initiatives, product design variations, and product mix changes.” The flow of the analysis goes from activity back to resource category. These are the steps to the process:
Determine the activities that will be influenced by the process or product change.
Construct spending profiles for each of the resource categories affected by the change. The profiles should be geared towards the change in short-term
expenditure profiles. This is a very important step in that many costs that are viewed as variable, such as
direct labor, in the short run are either fixed or at least a step function.
Reconcile activities at the resource center. Once you’ve determined the spending profile for that resource all activities that use that resource
must be modeled under the proposed operating scenario. This is so the organizational units that provide the resources have a
full picture of what is required of their organization and if the changing business scenario has an impact on their unit.
Develop the engineering relationships from activities back to resource categories. This is one of the hardest steps.
“A complete description of the functional relationships for all resource cost categories and activities requires a complex set of table
relationships.” These relationships must be evaluated at the current business state and the proposed changed state. The
difference between the current and proposed state for each resource in every activity impacted gives you the economic impact of your decision.
Process Management through Activity Networks
Activities networks are used to determine the commitment of resources on nonproductive processes of the organization. The activity networks are process maps for indirect and other support systems. The advantage of activity networks is that it helps keep managers process oriented. Mapping all processes both routine and exceptions (i.e., cost drivers) helps you understand the costs of the exceptions. Understanding the costs of the exceptions will help you focus on ways to eliminate these costs as you work toward continuous improvement.
Summary
“The framework offered in this article is not simple.” According to the authors it is probably unworkable except in an advanced manufacturing environment.
_________________________________________
Related summaries:
Berliner, C., and J. A. Brimson, eds. 1988. Cost Management for Today's Advanced Manufacturing: The CAM-I Conceptual Design. Boston: Harvard Business School Press. (Short Summary or Concepts), (Longer Summary).
Beynon, R. 1992. Change management as a platform for activity-based management. Journal of Cost Management (Summer): 24-30. (Summary).
Coburn, S., H. Grove and C. Fukami. 1995. Benchmarking with ABCM. Management Accounting (January): 56-60. (Summary).
Cokins, G. 1999. Using ABC to become ABM. Journal of Cost Management (January/February): 29-35. (Summary).
Keys, D. E. 1994. Tracing costs in the three stages of activity-based management. Journal of Cost Management (Winter): 30-37. (Summary).
Martin, J. R. Not dated. Activity based management models. Management And Accounting Web. ABM Models
Reeve, J. M. 1996. Projects, models, and systems -Where is ABM headed? Journal of Cost Management (Summer): 5-16. (Summary).
