Summary by Deborah Bichsel
Master of Accountancy Program
University of South Florida, Summer 2003
Management Theory Main Page | Strategy
Main Page | Structure/Restructure Main Page
According to the authors, traditional organizational charts are outdated. The concept of a chain of command, with top management is not necessarily an accurate illustration of the manner in which a company operates. If someone were to look at the organizational chart of a company, he or she may not obtain a good grasp of the organizational structure of a company. Thus, the authors suggest organigraphs in response to the changing structure of business and its management today.
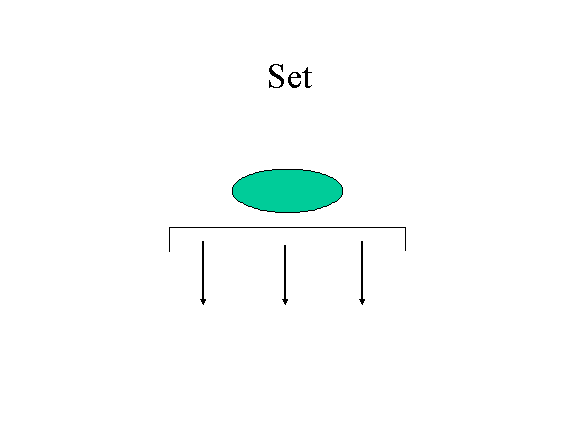
The most conventional types of organigraphs are the set and the chain. Both of these models are somewhat antiquated. The set is a “collection, a group, or a portfolio.” These sets share common resources and often are unrelated to one another. An example of a set would be a salesperson that has his unique set of customers and products. A car salesman, for example, would only be able to sell one make of car to his repeat clients. There would be no cross sales between salespersons. From a management perspective, a set has managers at the top of the set. These managers do not get involved in the actual business process, but rather supervise from a distance.
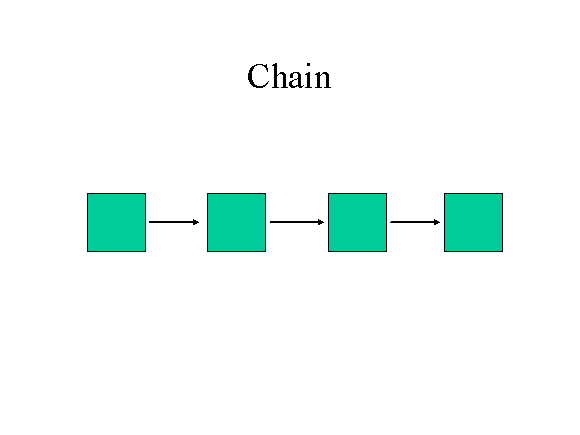
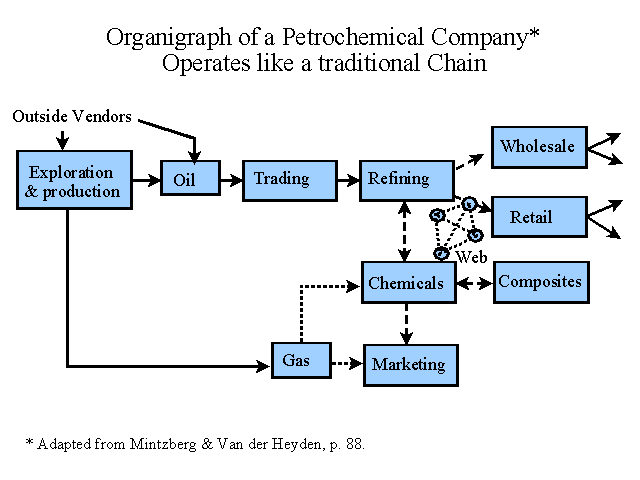
The second model is the chain. These show a connection between different events in a company. Combined, these events create a business process. Assembly lines and supply chains are two examples of the chain. Each chain in an organization has a manager. They oversee the entire process. Chains are fairly common in business today and companies would not exist without them.
Two other types of organigraphs are becoming common. The first is the hub. The hub serves as a central checkpoint, or coordinating center, for all process activities. This is the point through which “people, things [and] information move.” From a management perspective, the person at the center of the hub becomes the manager, or coordinator. The coordinator may not necessarily be in a “management” position. For example, a nurse may be a hub coordinator for patient care, rather than a doctor or hospital administrator.
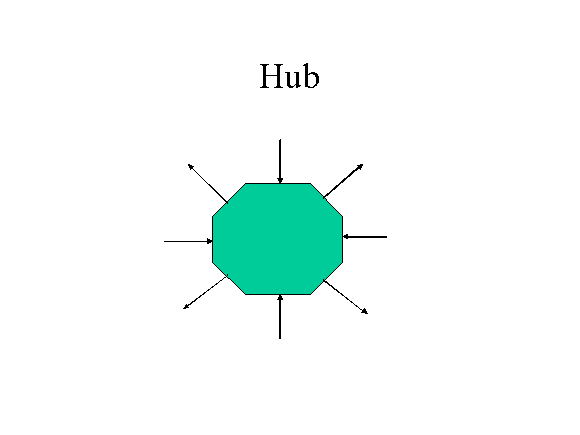
Chains may become hubs by transforming from a small process to a large operation. For example, a supply chain may become a hub for a manufacturing process. The chain is the hub for a larger process.
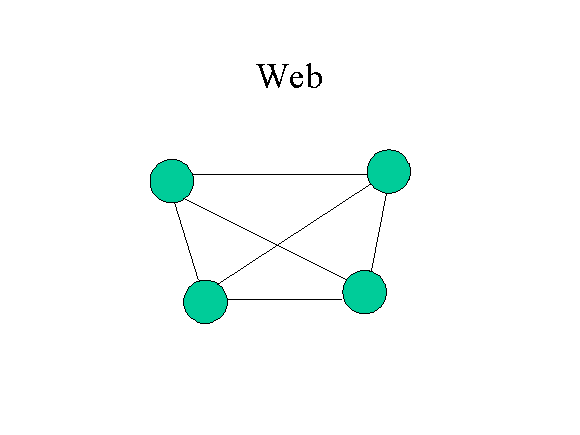
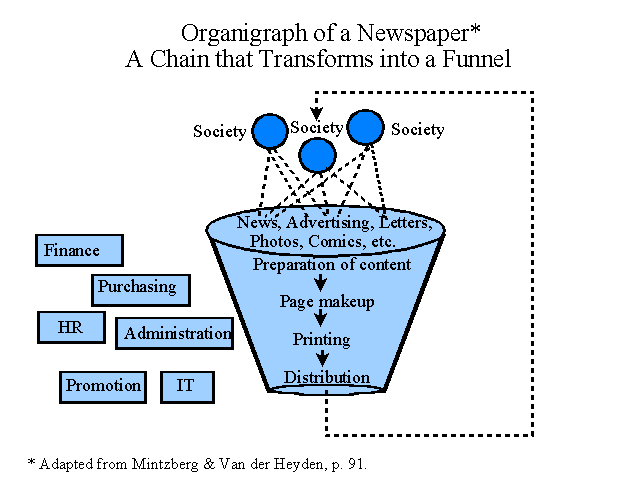
Another newer type of organigraph is the web. In a web structure, the company has several “nodes” that all communicate with each other, without going through a central coordinator. Webs allow for “open-ended communication and continuous movement of people and ideas.” There is no single manager for a web. Rather, all individuals may act in a management capacity. “Managers have to be everywhere.” Management structure may be loose or undefined.
While the organigraph is somewhat novel, companies have been using the concepts in their organizational structures for a long time. Other types of structures exist. The four discussed above are the most popular. However, any structure can be designed if it better depicts the organization of the company’s business processes. The more complex the company, the more complex the organigraph.
An organization is not restricted to one type of organigraph. It may have several business functions each represented by the different structures. As discussed before, a chain could be a hub for another, larger process. Also, companies may shift between the different types of organigraphs. It may begin as a more traditional set, move to a hub structure, and then transform into a web. If a company reorganizes, it may change the design of its organigraph.
A new idea exists, related to the core competencies of a company. A core competency is a group of “knowledge, skills or resources” that form a foundation for the structure of a business process. These competencies can be diagrammed as the hub of an organization. From this hub, all activities and processes of the company stem.
Organigraphs are not meant to replace the organizational chart. Instead, they provide for a new view of the organization. Organizational charts can still illustrate the authority of official management, but they do not represent the actual management of a company's business processes. In order to obtain the best understanding of a company’s operations, it would be to one’s advantage to look at both the organizational chart and the organigraph. See more illustrations below.
______________________________________________
Some Questions and Additional Graphic Illustrations
1. What is an organigraph?
An organigraph is a drawing, picture, or map of the way people and work are organized within an organization. It shows the connections and the interdependences to help managers see critical relationships and competitive opportunities. An organization chart, on the other hand, puts management at the top and treats everything and everyone as an independent box.
2. How do the different forms of organization (i.e., sets, chains, hubs, and webs) differ in terms of how they are managed?
According to the authors, managers of a set allocate, managers of a chain control, managers of a hub coordinate, and managers of a web link it all and energize.
3. What is the main point of this paper?
The authors point out that management is the servant of the organization, not its purpose and that management needs to be put in its proper place. The relatively new forms of organization (e.g., hubs and webs) require a different form of management that is very different from the older form that emphasized control. If companies are to prosper in today's economy, management needs to fit the organization whether at the center as in a hub or throughout as in a web.
_____________________________________________________
Related summaries:
Bonabeau, E. and C. Meyer. 2001. Swarm intelligence: A whole new way to think about business. Harvard Business Review (May): 107-114. (Summary).
Clinton, B. D. and S. C. Del Vecchio. 2002. Cosourcing in manufacturing. Journal of Cost Management (September/October): 5-12. (Summary).
Clinton, B. D. and S. C. Del Vecchio. 2002. Cosourcing in manufacturing - Just in time. Journal of Cost Management (November/December): 30-37. (Summary).
Cooper, R. and R. Slagmulder. 2003. Interorganizational costing, Part 1. Cost Management (September/October): 14-21. (Summary).
Cooper, R. and R. Slagmulder. 2003. Interorganizational costing, Part 2. Cost Management (November/December): 12-24. (Summary).
De Geus, A. 1999. The living company. Harvard Business Review (March-April): 51-59. (Summary).
Gosselin, M. 1997. The effect of strategy and organizational structure on the adoption and implementation of activity-based costing. Accounting, Organizations and Society 22(2): 105-122. (Summary).
Hammer, M. 1990. Reengineering work: Don't automate, obliterate. Harvard Business Review (July-August): 104-112. (Summary).
Johnson, H. T. 2006. Sustainability and "Lean Operations". Cost Management (March/April): 40-45. (Summary).
Kavadias, S., K. Ladas and C. Loch. 2016. The transformative business model: How to tell if you have one. Harvard Business Review (October): 90-98. (Summary).
Kim, W. C. and R. Mauborgne. 1997. Value innovation: The strategic logic of high growth. Harvard Business Review (January-February): 103-112. (Summary).
Kim, W. C. and R. Mauborgne. 1999. Creating new market space: A systematic approach to value innovation can help companies break free from the competitive pack. Harvard Business Review (January-February): 83-93. (Summary).
Kim, W. C. and R. Mauborgne. 2002. Charting your company's future. Harvard Business Review (June): 77-83. (Summary).
Kim, W. C. and R. Mauborgne. 2004. Value innovation: The strategic logic of high growth. Harvard Business Review (July/August): 172-180. (Reprint of their 1997 HBR article). (Summary).
Magretta, J. 1998. The power of virtual integration: An interview with Dell Computer's Michael Dell. Harvard Business Review (March-April): 72-85. (Summary).
O'Reilly, C. A. III. and M. L. Tushman. 2004. The ambidextrous organization. Harvard Business Review (April): 74-81. (Summary).
Ouchi, W. G. 1979. A conceptual framework for the design of organizational control mechanisms. Management Science (September): 833-848. (Summary and Comparison of the Control Mechanisms).
Ouchi, W. G. and A.M. Jaeger. 1978. Type Z organization: stability in the midst of mobility. Academy of Management Review (April): 305-314. (Summary).
Van Alstyne, M. W., Parker, G. G. and S. P. Choudary. 2016. Pipelines, platforms, and the new rules of strategy: Scale now trumps differentiation. Harvard Business Review (April): 54-62. (Summary).
Zhu, F. and M. Iansiti. 2019. Why some platforms thrive and others don't: What Alibaba, Tencent, and Uber teach us about networks that flourish. The five characteristics that make the difference. Harvard Business Review (January/February): 118-125. (Summary).
