Summary by Eileen Fried
Master of Accountancy Program
University of South Florida, Summer 2003
Continuous Improvement Main Page | SPC Main Page
The purpose of this article is to explain what “control charts” are, in non-technical terms, and how they can be used within the accounting profession to analyze, control and improve accounting processes. Statistical techniques have been employed in the manufacturing environment to improve quality and maintain control. The repetitive nature of several accounting processes and procedures lend themselves very well to this type of statistical analysis.
What are Control Charts?
Control charts are graphic representations of a collection of data points from a particular process over a period of time. They contain a centerline representing the process average or expected performance, as well as, upper and lower control limits that set bounds for an acceptable area of deviation from the centerline.
How are Control Charts Used?
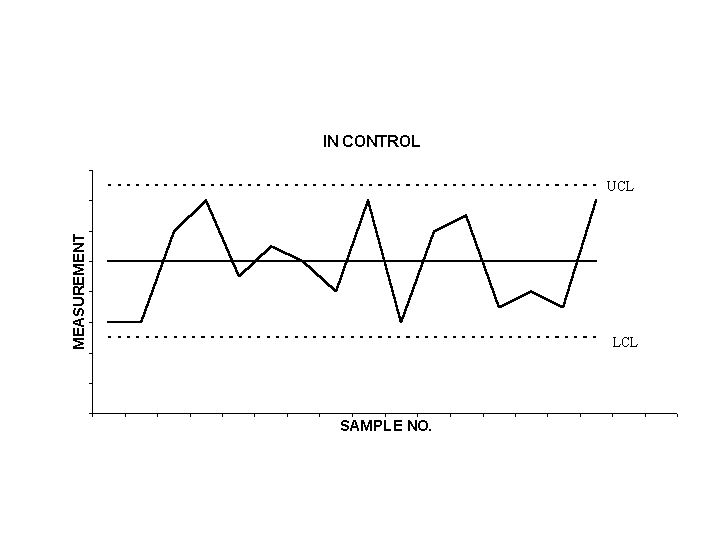
After a sufficient amount of data points have been plotted, it can be determined if a process is “in control” as shown in Figure 1 or “out of control” as shown in Figures 2 and 3.
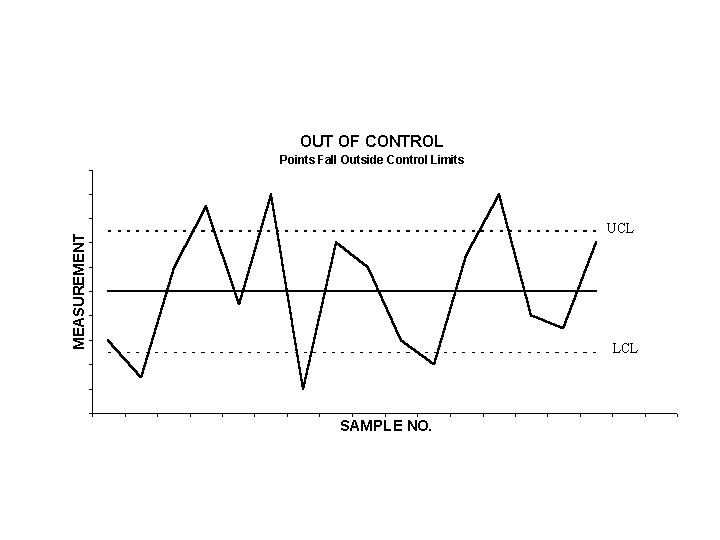
Figure 2
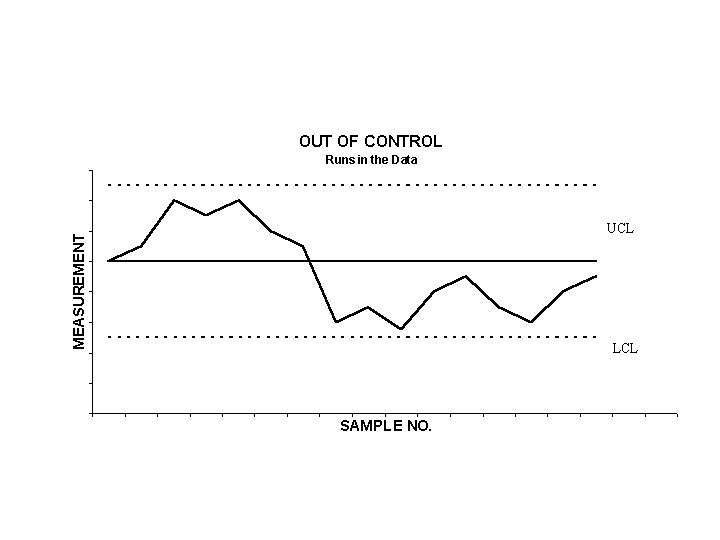
Figure 3
Data points falling outside the upper and lower control limits, as in Figure 2, would be investigated to determine the root cause for the deviation. As these causes are understood, corrective actions can be taken to prevent future “out of control” data points. While the data points in Figure 3 are all within the tolerance levels, the long running periods above or below the centerline indicate a change or shift in the process has occurred. The point at which the shift occurred should be investigated, so corrective action can be taken to bring the process back into control.
Applications in Accounting
The potential applications of control charts within accounting are numerous. Here are a couple of examples. You could measure efficiency, such as days it takes to process an invoice from a shipping document or days it takes to complete a monthly close. You could use control charts to help detect errors in data, such as charting your weekly payroll. A week where the payroll is significantly higher than prior weeks would be investigated to make sure there is a valid explanation. Some other potential applications of control charts in accounting include the following functions and measurements:
Payroll function - Number of audit exceptions in samples of employee pay records.
Accounts receivable billing - Average billing time.
Tax preparation - Proportion of unusable returns due to error.
Management travel and entertainment - Number of improperly authorized or documented expense vouchers.
Accounts payable - Number of invoices processed.
General accounting - Time required for monthly closing and statement preparation.
Accounts receivable & cash management - Age of accounts receivable.
Purchasing - Number of purchase discounts lost.
Sales personnel - Sales returns per salesperson when commissions are based on gross sales.
As is the case with any statistical data, you must be careful to clearly define the process you want to measure and chose the appropriate type of data chart that will properly measure the process. Selecting improper data can lead to “meaningless or misleading” results. In conclusion, proper use of control charts can help you improve performance and efficiency, which in turn can reduce cost, increase profits and improve both internal and external customer satisfaction.
___________________________________________________
Related summaries:
Albright, T. L. and H. Roth. 1993. Controlling quality on a multidimensional level. Journal of Cost Management (Spring): 29-37. (Summary).
Deming, W. E. 1993. The New Economics For Industry, Government & Education. Massachusetts Institute of Technology Center for Advanced Engineering Study. (Summary).
Francis, A. E. and J. M. Gerwels. 1989. Building a better budget. Quality Progress (October): 70-75. (Summary).
Holmes, D. S. and R. E. Hurley. 2003. How SPC enhances budgeting and standard costing - Another look. Management Accounting Quarterly (Fall): 57-62. (Summary).
Kim, M. W. and W. M. Liao. 1994. Estimating hidden quality costs with quality loss functions. Accounting Horizons (March): 8-18. (Summary).
Lucier, G. T. and S. Seshadri. 2001. GE takes six sigma beyond the bottom line. Strategic Finance (May): 40-46. (Summary).
Martin, J. R. Not dated. Chapter 3: Cost Behavior Analysis & Statistical Process Control - Part II. Management Accounting: Concepts, Techniques & Controversial Issues. Management And Accounting Web. Chapter 3 Part II
Martin, J. R. Not dated. What is Six Sigma? Management And Accounting Web. Six Sigma Summary
Nolan, T. W. and L.P. Provost. 1990. Understanding Variation. Quality Progress (May): 70-78. (Summary).
Reeve, J. M. 1989. The impact of variation on operating system performance. Proceedings of the Third Annual Management Accounting Symposium. Sarasota: American Accounting Association: 75-89. (Summary).
Roehm, H. A., L. Weinstein, and J. F. Castellano. 2000. Management control systems: How SPC enhances budgeting and standard costing. Management Accounting Quarterly (Fall): 34-40. (Summary).
Roth, H. P. and T. L. Albright. 1994. What are the costs of variability? Management Accounting (June): 51- 55. (Summary).
Taguchi, G. and D. Clausing. 1990. Robust quality. Harvard Business Review (January-February): 67-75. (Summary).
