Summary by Lee Salemi
Master of Accountancy Program
University of South Florida, Fall 2004
PLC Main Page | Strategy
Related Main Page | Structure and Restructure Main Page
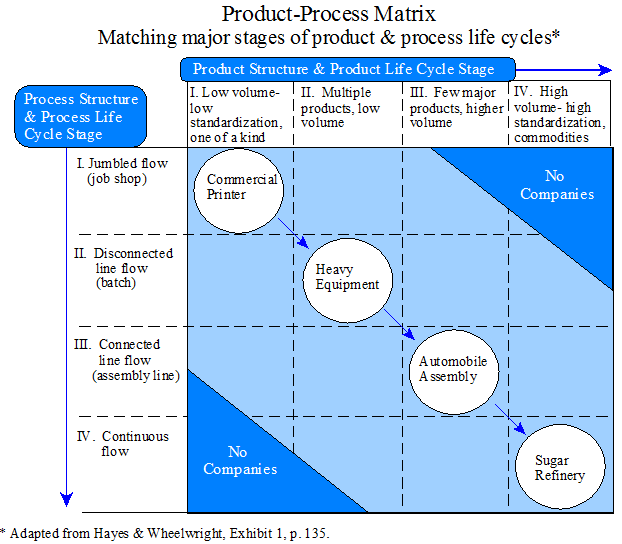
This article is the second in a two-part sequence of articles 1 . In this article the authors address the effects of changing a company’s products or production processes due to changes in the market, changes in technology, or external changes that corporate management must constantly consider. The authors continue to utilize their “product-process matrix” (See Exhibit below) in describing the effects of alternative business strategies. As in the previous article, Hayes and Wheelwright stress that coordination and understanding between the manufacturing and marketing functions is critical for success.

(The note below the matrix refers to the page number in the first article, but the illustration also appears on page 128 of this article.
Change in Position
The authors suggest that any change in the positioning of either products or production processes will expose a company to two kinds of danger. The first danger is change that does not correspond between products and processes, leading to less focus and more difficulty in the coordination of manufacturing and marketing. The second danger involves responding to a change in either products or processes by broadening the activity in the other instead of using a corresponding shift. The authors state these dangers can cause a company to lose focus, which is important to both marketing and manufacturing.
Four Major Types of Growth
Companies generally pursue four major types of growth. Although other forms exist, they are usually variations or combinations of the four major types. Type 4 is the most complex, while Type 1 is the simplest type of growth. All four types of growth can be better understood by utilizing the authors’ “product-process matrix.” The natural progression through the matrix is down the diagonal path. However, the diagonal movement should be considered the industry average or mean, because companies are likely to make only one kind of change at a time – either a change in product or process.
Type 4: New Markets
This type of growth is the most complex and deals with expansion into new products and markets. Entering a new market may cause a company to create an entirely new matrix, because the old one cannot be used. More often though, getting involved in a new market pressures a company to expand its product line and retreat to the left and horizontally on the matrix. Type 4 growth often leads to a phenomenon known as “creeping breakeven.” To expand product lines or to enter new markets, significant investments must be made. These increased investments raise the company’s breakeven point offsetting the gains from the increased sales volume.
Type 3: Vertical Integration
Vertical integration occurs when the scope of the production process is broadened. The company can add less standardized, more flexible processes (forward integration) or more standardized, less flexible processes (backward integration) in an attempt to increase sales or decrease costs. A problem that companies run into with this type of growth is that the expansion of processes often leads to production of a completely different product needing a new matrix. If the company continues to utilize the old matrix with the newly added processes, the company may be producing the part with an inappropriate process and organizational structure.
Type 2: Product Growth
This type of growth involves broadening the product line within a single market, using an existing process. This can occur by either adding more standardized products while maintaining existing, less standardized products or by adding special features to an existing, more standardized product line. Either way, the positioning on the matrix will shift to the left. This may cause the company’s product structure to place unreasonable strain on the production processes.
Type 1: Simple Growth
Simple Growth refers to the simple growth of sales volume within an existing product line and market. This requires very stable conditions to exist regarding competition, technology, and market desires. Regarding Type 1 growth, the company must make decisions relating to entering and exiting a specific market as well as the strategy to be pursued while the company participates in the market.
Entrance-Exit Strategies
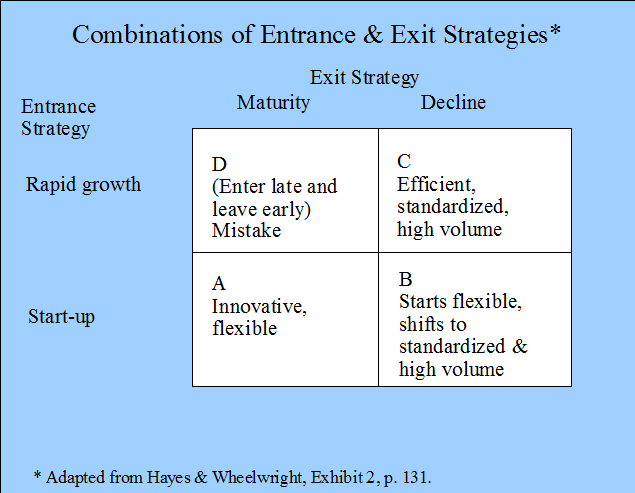
There are four entrance exit strategies that a company may choose to follow. The authors refer to the strategies as A, B, C, and D.

Strategy A is when a company enters the market early and exits when technology stabilizes and profit margins narrow. After leaving the market, the company attempts to exploit its flexibility and technological skills by introducing a different product. This is largely regarded as the strategy for the little guys. However, it is also attractive for companies that prefer not to compete in high-volume – low-margin businesses.
Strategy B is when the company enters the market early and remains throughout the product’s entire life cycle. This is often considered the normal or most desirable strategy.
Under Strategy C, the company waits to enter the market until some product and process stability has occurred and then enters exploiting its massive production, distribution, and marketing resources. This strategy is largely favored by national or multinational companies with systems of production that emphasize high, stable volumes and low, variable costs.
Strategy D occurs when a company intends to follow strategy C, but the company fails to gain market share and as a result, chooses to withdraw without making an adequate return on its investment. This strategy is never pursued intentionally.
Paths on the Matrix
Once an entrance-exit strategy is chosen, management must choose a strategy for product and process developments. It is rarely possible for a company to move perfectly down the diagonal line of the matrix. A company will usually attempt to stay as close to the diagonal line as possible. Being positioned above the line means maintaining flexibility to change products, production volumes, and processes quickly. However, the company may be vulnerable to others who can offer lower prices, better delivery, and tighter product specifications. Keeping a position below the line is not desirable either, because it will result in an increase in capital investment and breakeven point. As a company moves too far away from the matrix diagonal in either direction, it becomes increasingly dissimilar from its competitors and coordination between marketing and manufacturing is affected. The two functions will begin to respond to different opportunities and move in different directions.
The Learning Curve and the Matrix
To remain competitive, product cost should decline at a steady rate every time cumulative production volume doubles. As a product goes through its life cycle, there are numerous opportunities for cost reduction. The same is true of movement through the production process cycle. Movement down the matrix diagonal represents a balanced progression of product and process changes. The company will be able to take advantage of potential cost improvements from both product and process changes while still maintaining flexibility to respond to market shifts. A movement below the matrix diagonal would lead to greater cost reduction, but the company may become too inflexible to product changes.
____________________________________________
1 See Hayes, R. H. and S. C. Wheelwright. 1979. Link manufacturing process and product life cycles. Harvard Business Review (January-February): 133-140. (Summary).
Other related summaries:
Adamany, H. G. and F. A. J.Gonsalves. 1994. Life cycle management: An integrated approach to managing investments. Journal of Cost Management (Summer): 35-48. (Summary).
Artto, K.A. 1994. Life cycle cost concepts and methodologies. Journal of Cost Management (Fall): 28-32. (Summary).
Clinton, B. D. and A. H. Graves. 1999. Product value analysis: Strategic analysis over the entire product life cycle. Journal of Cost Management (May/June): 22-29. (Summary).
Czyzewski, A. B. and R. P. Hull. 1991. Improving profitability with life cycle costing. Journal of Cost Management (Summer): 20-27. (Summary).
Martin, J. R. Not dated. Product life cycle management. Management And Accounting Web. PLCSummary.htm
Moores, K. and S. Yuen. 2001. Management accounting systems and organizational configuration: A life-cycle perspective. Accounting, Organizations and Society 26(4-5): 351-389. (Summary).
Porter, M. E. 1980. Competitive Strategy: Techniques for Analyzing Industries and Competitors. Chapter 8: Industry Evolution. The Free Press. (Summary).
Shields M. D. and S. M. Young. 1991. Managing product life cycle costs: An organizational model. Journal of Cost Management (Fall): 39-51. (Summary).