Summary by Christina Thayer
Master of Accountancy Program
University of South Florida, Fall 2004
PLC
Main Page | Strategy
Related Main Page | Structure and Restructure Main Page
This article is the first in a two part sequence of papers (See note). The authors stress the importance of using a process life cycle in choosing among the different manufacturing and marketing options. The authors contend that simply using the traditional product life cycle for decision making can place too much emphasis on marketing alone. Individual companies will often find this to be too simplistic and misleading for strategic planning. Hayes and Wheelwright suggest that separating the product life cycle concept from the process life cycle concept will help management better understand the strategic options available to a company, specifically with respect to the manufacturing function.
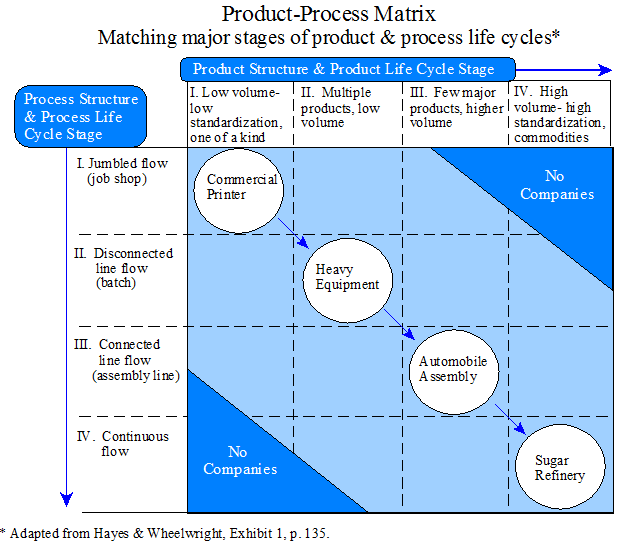
The Product-Process Matrix
The article describes a series of stages that the production process passes through. The process evolution begins with a very flexible process that is not very cost efficient. As time passes, the process becomes more standardized, mechanized, and automated. The end of the cycle is characterized by a very systematic process that is very efficient, but extremely capital intensive and inflexible. Similarly, products go through life cycle stages that we are more familiar with than the process counterpart. The process life cycle is illustrated by a product-process matrix which represents the interaction of the product and process lifecycles. The rows represent the stages through which a production process passes (flexible form in the top row to systematic form in the bottom row), and the columns represent the different product life cycle phases (great variety start-up phase on the left hand side to standardized commodity mature phase on the right hand side). A company can be characterized by its position on the matrix. The positions (regions) are determined by the company’s choice of production process and the stage of the product life cycle the particular product is in. For example, a company (or business unit) in the upper left hand corner would probably produce a product where each job is unique and capacity is rarely used at 100%. A company (or business unit) in the lower right hand corner would most likely produce a product such as a commodity where the production process is continuous, capital intensive, and inflexible.
The natural flow of the matrix is a negatively sloped line from the top left corner to the bottom right. Although some companies may deviate slightly from the line, no company would produce a product in either the upper right or lower left corner, where the product would either be too specialized or the process too uneconomical. As a company moves farther from the diagonal, it becomes increasingly dissimilar from its competitors. In certain instances, this may prove to be an advantage. However, if the company cannot find a way to exploit the advantages of its particular niche, it becomes more vulnerable to attack from competitors.
Using the Concept
Hayes and Wheelwright discuss three issues that follow from the product-process life cycle. The first issue is Distinctive Competence, which involves a company recognizing areas where they are strong relative to their competitors and areas where they are weak and should avoid competition.
The second issue relates to the implications of selecting a particular product-process combination. As a company undertakes different combinations of products and processes, management must realize that it is the interaction between these two elements that determines which tasks will be critical. Different types of process structure provide different competitive advantages. For example, the advantage of the jumbled flow or job shop is flexibility in terms of both product and volume. A more standardized process emphasizes reliability and cost.
The final issue is how operating units are organized. This involves organizing different company units so that they can specialize in separate portions of the total manufacturing task and still maintain overall coordination. Several examples are provided to illustrate these issues. One example involves the way Texas Instruments shifted competitive strategy in the 1970s. This is illustrated in the graphic below that shows one circle for TI's old watch strategy and one for TI's new watch strategy. Another example relates to Lynchburg Foundry that operated five plants in Virginia. Each plant competed in a different way as illustrated by their different positions in the product-process matrix.
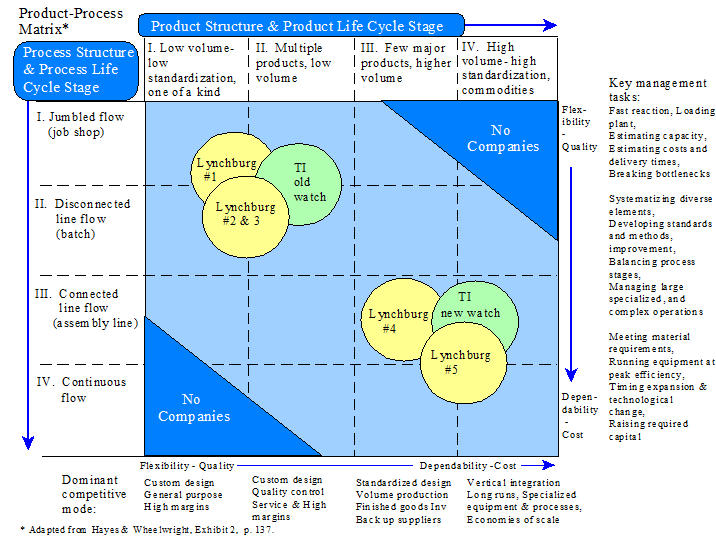
The authors briefly discuss adding more dimensions to the product-process matrix. (Note that the dominant competitive modes are listed at the bottom of the illustration, and the key management tasks are listed on the right hand side). This expansion of the matrix encourages more creative thinking about organizational competence and competitive advantage. It can also guide the way to more informed predictions regarding the changes that are likely to occur in a particular industry and to more in-depth consideration of the strategies that might be followed in responding to such changes. The product-process matrix provides a natural way to involve manufacturing managers in the planning process so they are in a position to relate their opportunities and decisions more effectively with marketing strategy and corporate goals.
The authors conclude by stressing the importance of the interrelation of marketing and manufacturing decisions. Companies must decide how they are going to compete by choosing a product or marketing strategy (e.g., broad or narrow product line), followed by a type of manufacturing system (e.g., flexible with higher cost or less flexible with lower costs). These decisions must be continuously reviewed and changed as the company’s products and competitors evolve and mature.
___________________________________________
1 See Hayes, R. H. and S. C. Wheelwright. 1979. The dynamics of process-product life cycles. Harvard Business Review (March-April): 127-136. (Summary).
Other related summaries:
Adamany, H. G. and F. A. J.Gonsalves. 1994. Life cycle management: An integrated approach to managing investments. Journal of Cost Management (Summer): 35-48. (Summary).
Artto, K.A. 1994. Life cycle cost concepts and methodologies. Journal of Cost Management (Fall): 28-32. (Summary).
Clinton, B. D. and A. H. Graves. 1999. Product value analysis: Strategic analysis over the entire product life cycle. Journal of Cost Management (May/June): 22-29. (Summary).
Czyzewski, A. B. and R. P. Hull. 1991. Improving profitability with life cycle costing. Journal of Cost Management (Summer): 20-27. (Summary).
Martin, J. R. Not dated. Product life cycle management. Management And Accounting Web. PLCSummary.htm
Moores, K. and S. Yuen. 2001. Management accounting systems and organizational configuration: A life-cycle perspective. Accounting, Organizations and Society 26(4-5): 351-389. (Summary).
Porter, M. E. 1980. Competitive Strategy: Techniques for Analyzing Industries and Competitors. Chapter 8: Industry Evolution. The Free Press. (Summary).
Shields M. D. and S. M. Young. 1991. Managing product life cycle costs: An organizational model. Journal of Cost Management (Fall): 39-51. (Summary).
