Summary by James R. Martin, Ph.D., CMA
Professor Emeritus, University of South Florida
Investment Management Main Page | PLC
Main Page | Research Methods Main Page
The purpose of this paper is to explore the relationships between variations in management accounting systems (MAS) and organizational life cycles. The authors use a configuration approach based on the idea that contextual variables (e.g., environments, technologies, strategies, cultures and processes) cluster together into configurations of archetypes at different stages of a company's life cycle. More specifically, they address whether management accounting systems (MAS) differ at different life cycle stages and whether these differences reveal a pattern of change.
Organizational Configurations, Life Cycles and MAS
| Adaptation of Table 1: Organizational Characteristics Across Life-Cycle Stages | ||||||
| Characteristics | Birth | Growth | Maturity | Revival | Decline | |
| Strategy | Mission | Selective build | Aggressive build | Hold harvest | Aggressive build | Hold divest |
| Level of service product innovation | Considerable | Incremental | Low | Substantial | Low | |
| Scope of product market | Narrow | Broad | Consolidated | Diversified | Consolidated | |
| Structure | Structure of activities | Informal and un differentiated | Moderately formal and differentiated | Formal and moderately differentiated | Formal and highly differentiated | Very formal and moderately differentiated |
| Concentration of authority | Highly decentralized | Decentralized | Moderately decentralized | Decentralized for divisional decisions | Moderately decentralized | |
| Leadership style | Initiation of structure | High | Medium | Medium | High | Medium |
| Consideration | Low | High | Medium | Medium | Low | |
| Decision making style: | Decisive | Integrative | Hierarchical | Flexible | Decisive | |
| Amount of information used | Minimum | Maximum | Maximum | Minimum | Minimum | |
| Degree of focus in use of data | Single solution | Multiple solutions | Single solution | Multiple solutions | Single solution | |
The framework is based on Miller and Friesen's five stage life cycle model1 illustrated in the table above along with the organizational characteristics expected for the various life cycle stages.
The research framework includes the organizational life cycle for three reasons:
The life cycle concept:
1. may provide a better framework than the contingency framework,
2. may provide prescriptions for MAS design, and
3. it may help in analyzing the relationships between MAS and the firms' internal characteristics that provide implications for organizational effectiveness.
Research Framework
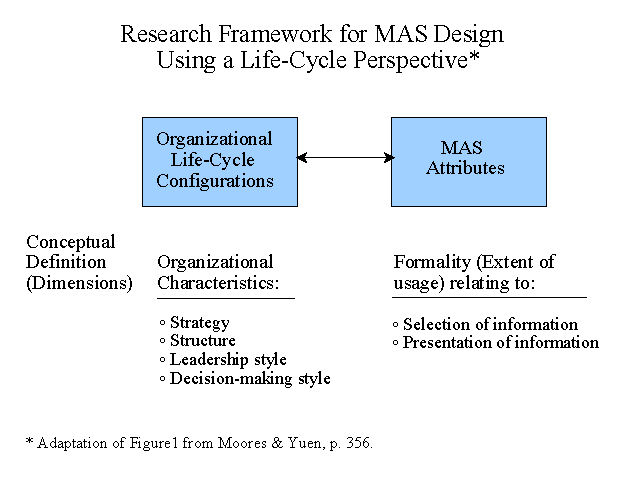
The research framework is illustrated in the graphic below and is based on the idea that strategies, structures and management styles vary across life-cycle stages, and that changes in MAS need to be made at different stages to maintain internal consistency.

Hypotheses
The hypotheses are based on the expectation that each life-cycle stage is associated with a different management accounting system.
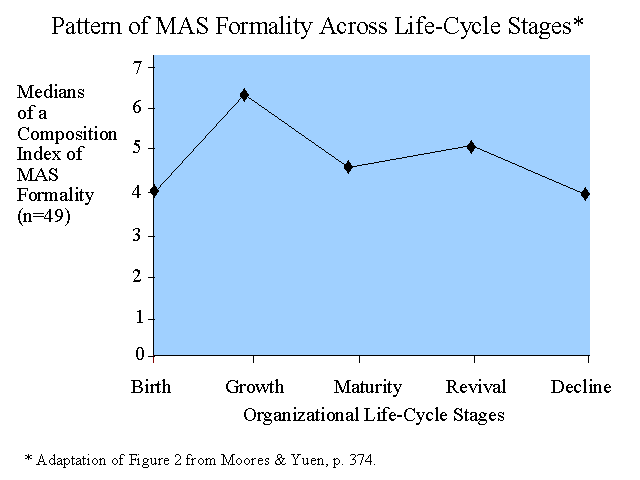
H1: "MAS formality (in terms of selection and presentation of information) across organizational life-cycle stages will increase from birth to growth, relax at maturity, and increase slightly at revival before decreasing during decline." (p.358)
More specifically, birth stage firms rely on informal control while growth stage firms rely on formal rules and procedures, diagnostic controls, participative budgeting, responsibility accounting, cash flow statements and capital budgeting. Mature firms are expected to rely on a more narrow range of tools than growth stage firms. Revival stage firms become highly decentralized with more flexible decision-making styles, use less data and use a more narrow range of tools for generating information. Decline stage firms control from the top down and also use a narrow range of MAS tools.
H2 (a): "In terms of selection of information, firms at the growth and maturity stages will rely on a broader range of managing accounting tools than firms at birth, revival and decline stages." (p.360)
Birth stage firms are expected to use the least aggregated and integrated information. Growth stage firms will use more aggregated and integrated information. Mature firms are expected to use less aggregated and less integrated information as they become more centralized and adopt a more intuitive decision-making style. Revival stage firms are similar to growth stage firms in terms of using aggregated and integrated information. Firms in the decline stage are expected to use less aggregated and integrated information.
H2 (b): "In terms of presentation of information, the levels of aggregation and integration will be higher, and the scope will be broader at the growth and revival stages than at other stages. Firms at the growth and revival stages will require timely information more than firms at other life-cycle stages." (p. 361)
Method
The research involved survey and field studies in the Australian clothing and footwear industry. Questions related to the extent management control tools were used, how information was presented in terms of aggregation, integration, scope and timeliness, and self reported measures of organizational effectiveness.
Data Analysis
There were 49 usable responses representing a 14.5% response rate to the survey. Factor analysis was conducted to reduce the variables to a manageable size, followed by cluster analysis (the hierarchical agglomerative technique) to classify firms into life cycle stages. The factor analysis produced four factors for strategy, and two each for structure, leadership and decision-style. The cluster analysis produced five clusters.
Descriptive statistics are provided in a rather involved Table 2, not included here. The clusters were labeled, with some difficulty, by comparing the characteristics of each cluster with a priori theory. This information is presented below in an adaptation of Table 3. The clusters were labeled birth (Cluster 5, 2 firms), growth (Cluster 1, 1 firm), maturity (Cluster 3, 29 firms), revival (Cluster 4, 5 firms) and decline (Cluster 2, 9 firms).
| Adaptation of Table 3: Preliminary Labels of Clusters | |||||
| Basis of Labeling | Clusters | ||||
| One (1 firm) |
Two (9 firms) |
Three (29 firms) |
Four (5 firms) |
Five (2 firms) |
|
| Age in years | Growth | Maturity Revival Decline |
Maturity Revival Decline |
Maturity Revival Decline |
? |
| Performance weighted scores |
Growth Revival | Decline Birth | Maturity | Revival Growth | Birth Decline |
| Sales growth rates | Growth Revival | Decline | Maturity Birth | Maturity Birth | ? |
| Preliminary labeling |
Growth | Decline | Maturity | Revival | Birth |
Kruskal-Wallis and Man-Witney U-tests revealed significant differences in MAS across stages. This data is presented in Tables 4 and 5, not included here.
The authors used the data-triangulation approach on interview discussion in the field studies to deduce the MAS attributes of the case firms.
Discussion and Integration of Findings
The results showed distinctive patterns of firms characteristics and MAS formality across life-cycle stages and offers support for H1 as illustrated in the graphic below.

The findings provide reasonable support for H2 (a). Firms at the birth stage and maturity stage rely less on formal MA tools than firms at the growth stage. More formal MAS are used at the revival stage than at the maturity stage. Significant between-stage differences were found in performance evaluation, cash-flow statements, reliance on capital budgeting and long term planning.
The findings also support H2 (b). Firms at the growth and revival stages rely more on higher levels of aggregation and integration as well as more timely information. Birth firms show a more narrow scope of information use. But timely information appears to be important at all life cycle stages.
Conclusions and Limitations
The findings provide some support for the hypotheses and suggest practical prescriptions for MAS design. Limitations include a limited sample size, low response rate, judgments required in cluster analysis and the CEO's self reported measures. According to the authors, the study provides a significant contribution in that it reinforces the benefits of applying the configuration approach to examine MAS.
__________________________________________
1 Miller, D. and P. H. Friesen. 1980. Archetypes of organizational transition. Administrative Science Quarterly (25): 268-299.
Related summaries:
Adamany, H. G. and F. A. J. Gonsalves. 1994. Life cycle management: An integrated approach to managing investments. Journal of Cost Management (Summer): 35-48. (Summary).
Artto, K.A. 1994. Life cycle cost concepts and methodologies. Journal of Cost Management (Fall): 28-32. (Summary).
Clinton, B. D. and A. H. Graves. 1999. Product value analysis: Strategic analysis over the entire product life cycle. Journal of Cost Management (May/June): 22-29. (Summary).
Czyzewski, A. B. and R. P. Hull. 1991. Improving profitability with life cycle costing. Journal of Cost Management (Summer): 20-27. (Summary).
Hayes, R. H. and S. C. Wheelwright. 1979. Link manufacturing process and product life cycles. Harvard Business Review (January-February): 133-140. (Summary).
Hayes, R. H. and S. C. Wheelwright. 1979. The dynamics of process-product life cycles. Harvard Business Review (March-April): 127-136. (Summary).
Martin, J. R. Not dated. Product life cycle management. Management And Accounting Web. PLCSummary
Porter, M. E. 1980. Competitive Strategy: Techniques for Analyzing Industries and Competitors. Chapter 8: Industry Evolution. The Free Press. (Summary).
Shields M. D. and S. M. Young. 1991. Managing product life cycle costs: An organizational model. Journal of Cost Management (Fall): 39-51. (Summary).