Summary by Erin Lagor
Master of Accountancy Program
University of South Florida, Fall 2004
Budgeting Main Page | SPC
Main Page | Standard Costing Main Page
The following summary should be read first. This article is a direct response to Roehm, Weinstein, and Castellano. 2000. Management control systems: How SPC enhances budgeting and standard costing. Management Accounting Quarterly (Fall): 34-40. (Summary).
In order to understand the purpose of Holmes and Hurley’s article, one must first have a general understanding of the Roehm, Weinstein and Castellano article (Hereafter referred to as the RWC article for brevity’s sake). In the RWC article, the authors’ purpose is to show the effect of statistical process control (SPC) when evaluating a standard against an actual result. In that article, the authors applied an SPC technique, an X-Moving Range Chart, to test the stability of productivity data for J&J Inc.’s widget production.
The RWC article concludes that their process is “in control” and stable when it produces 55 widgets per hour with 40 workers. The data they used in their analysis included the daily units (the total number of widgets produced per day) for two different shifts of employees. Holmes and Hurley’s article (Hereafter referred to as H&H for brevity) examine this same fictitious example of J&J Inc.’s widget production, but come to a new conclusion about what constitutes being “in control” or stable. H&H believe that there is no significant statistical difference between the production levels of the two shifts from the RWC example. They assert that keeping the shift information separate distracts us when analyzing the data for stability.
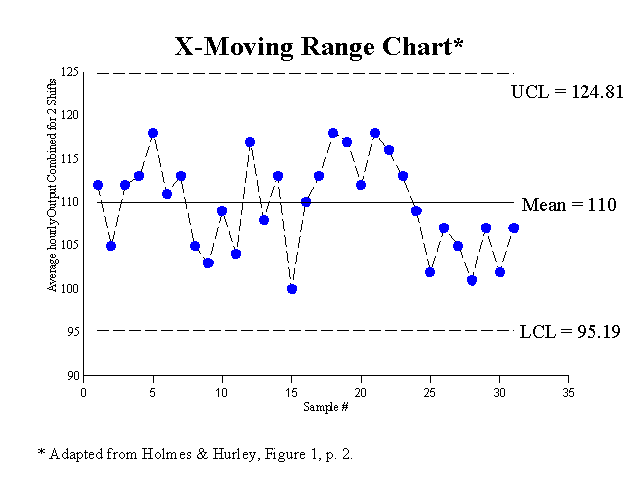
Therefore, H&H combined the two shifts of data into one set. They created their own X-Moving Range Chart for total daily production. Their chart looked like this:

H&H point out that all the data points are within the control limits, as the RWC article asserts, but that there are unusual patterns that could not be seen among the data before the two shifts were combined. These unusual patterns in the data imply that the process is in fact NOT stable. Nonrandom events have occurred, despite the fact that all the data points are within the control limits. Looking carefully at the above figure, one can see that discernable patterns do in fact exist. Thus, there must be one or more assignable or controllable causes within the production environment of J&J, Inc. The discernable patterns include the following: The last eight days of the production were below the average value of 110, and the previous seven days were all above the average. This indicates that the process is NOT stable. (Recall that the RWC article indicated 55 hours as the mean; because the two shifts have been combined, one would expect the mean to double in size. For this reason, the mean on the above figure is 110 instead of 55).
H&H computed the probability that there could be a pattern of seven consecutive points above the average, followed by a pattern of eight consecutive points below the average, from a random process. The probability that this could happen was less than 0.008. Based on this extremely low probability, H&H conclude that nonrandom events must have caused these patterns. They suggest that the management of J&J, Inc. should investigate the reasons for the unusually high and low production levels for these two back-to-back periods. Possible causes could be different raw materials, different work teams, different products, etc. But the most important thing is to determine the causes and capitalize on this knowledge.
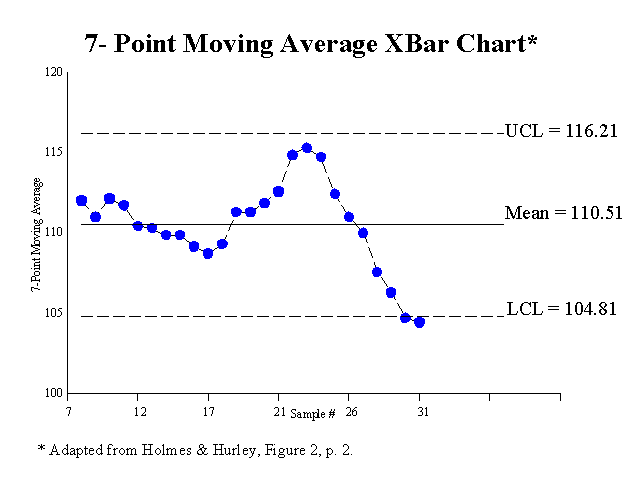
To further support their assertion that the process is unstable, H&H use another statistical tool to illustrate their point. The 7-Point Moving Average of the Daily Production can be seen below:

This figure illustrates that the daily production level has actually been on a downhill slope. Thus, the process must not be in control, and RWC’s recommendation that the standard should be 60 instead of 55 is probably not the best idea.
Conclusion
In conclusion, H&H do not believe that the control process for the fictitious data indicates process stability. Rather, the reasons for the up and down averages in production for the third and fourth weeks should be sought.
In turn, however, RWC got the chance to respond to H&H’s article as well. They had the opportunity to assert that they were right in NOT combining the data of the two shifts. They referenced Wheeler (an expert on SPC), when stating that it was the right thing to keep these two subgroups separate. According to Wheeler, “If there is any possibility that two things may differ, make sure that they are in different subgroups…The control chart looks for differences between subgroups. It uses the variation within the subgroups to define how much variation to ignore in this quest. Therefore, by minimizing the variation within each subgroup and maximizing the opportunity for variation from subgroup to subgroup, one will get useful and sensitive control charts.”
RWC made a valid point in continuing to defend their position. They asserted: “Special cause variation could develop for one shift but not another. If we were to combine the shifts into a single data point, we might not detect this special cause variation and miss an opportunity to improve the process in the future.”
Finally, the two groups of authors agree that statistical process control tools should be used by managerial accountants. But they disagree on the interpretation of the SPC data! Our questions in class related to whether the two shifts should be combined (See the RWC summary).
____________________________________________
Related summaries:
Albright, T. L. and H. Roth. 1993. Controlling quality on a multidimensional level. Journal of Cost Management (Spring): 29-37. (Summary).
Francis, A. E. and J. M. Gerwels. 1989. Building a better budget. Quality Progress (October): 70-75. (Summary).
Nolan, T. W. and L.P. Provost. 1990. Understanding Variation. Quality Progress (May): 70-78. (Summary).
Reeve, J. M. 1989. The impact of variation on operating system performance. Proceedings of the Third Annual Management Accounting Symposium. Sarasota: American Accounting Association: 75-89. (Summary).
Reeve, J. M., and J. W. Philpot. 1988. Applications of statistical process control for financial management. Journal of Cost Management (Fall): 33-40. (Summary).
Roehm, H., A. L. Weinstein, and J. F. Castellano. 2000. Management control systems: How SPC enhances budgeting and standard costing. Management Accounting Quarterly (Fall): 34-40. (Summary).
Walter, R., M. Higgins and H. Roth. 1990. Applications of control charts. The CPA Journal (April): 90-93, 95. (Summary).