Summary by Morales
Master of Accountancy Program
University of South Florida, Summer 2002
Budgeting Main Page | Deming Main Page | SPC
Main Page
Francis and Gerwels claim that using statistical methods in business management is beneficial. This idea stemmed from the realization that managers work and struggle with variations daily. The authors assert the importance of managers taking control and managing variations. They can improve their handling of variations by understanding and applying Shewhart's and Deming’s theories of management.
There are two kinds of variations: controlled and uncontrolled. According Francis and Gerwels, recognizing the difference between the need for fundamental system changes and correction of the present system is how management can effectively improve a system. In order to accomplish this, managers must differentiate between controlled and uncontrolled variations.
Controlled variations are the result of chance causes, also called common causes, which are faults of the system. Uncontrolled variations are caused by assignable causes, also called special causes, which indicate an event, from a particular group (workers, area, machine), has occurred in the system. In order to control special cause variation, it should be eliminated, when found. Special causes are delegated to lower levels of management for example, local supervisors and workers. Common cause variations are the responsibility of those managing the system itself, i.e., the senior levels in management.
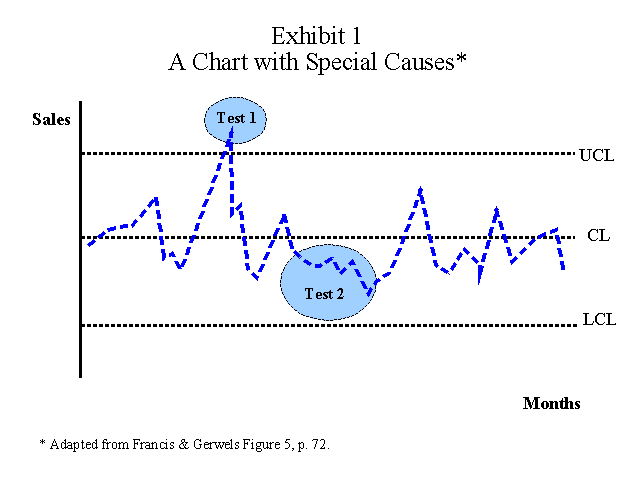
There are two tools introduced in the article that are helpful in differentiating between special and common causes: the special cause chart and the Deming Cycle. The special cause chart is used to track sample statistics (data on the product, service, or process) over time. It is made up of three based lines: central (CL), upper control limit (UCL), and lower control limit (LCL). Although there was no detailed explanation about the spread between the lines, the authors insist, "The spread is essential in characterizing the variation as special or common causes. (See MAAW's Chapter 3 for how limits are established). The limits in this chart are from statistically based calculations using the data (71)." If any points exceed the limits (test #1, see Exhibit 1), special causes are indicated. It might be worthwhile to investigate, track down, eliminate the source and takes steps to make sure it does not occur again. If the points are within the limits, special causes might still be occurring, but in the form of data patterns (shown as test #2 where seven points in a row appear below the center line in Exhibit 1). If there are no special causes, the chart represents a system identifier showing the natural variation in a stable system. Reducing common cause variation requires a fundamental improvement in the system.
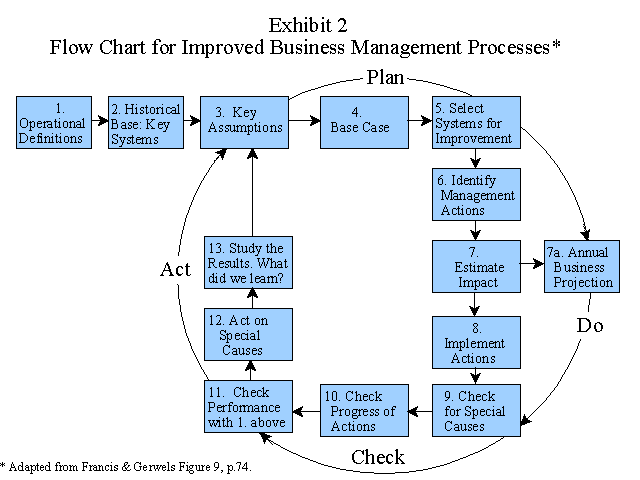
Francis and Gerwels maintain that improvement through fundamental change should be based on new knowledge and new ideas. The Deming-Shewhart Cycle then follows as a facilitating guide to this "new knowledge." The four activities included in this cycle are: plan, do, check, and act (See graphics). Plan the action or change, do it, check it (i.e., study the results), and act. Though very simple, they declare, "Its use is absolutely fundamental to never-ending improvement to systems". (71)
The authors also presented a flow chart for improved business management process, that consists of 13 steps (Exhibit 2). They offer some comments or advise:
The budget should start at the senior management level.
Operational definitions must be specified. These definitions are usually the outcome of strategic planning considerations for the company. (See MAAW's Chapter 1 for operational definitions).
Assumptions that will influence the upcoming budget period for example, inflation and plant outages, must be determined.
Decisions must be made on which systems management will focus to bring about improvements. Actions must be developed and the impact of the changes must be estimated.
The performance of the change or changes should be checked against the "operational definitions" stated.
The process should be repeated.
There should be no exact time period to complete a cycle. It should solely be based on the time required to implement system changes.

The authors also compare the typical/classical and proposed/new approach to budgeting. Under the typical budgeting approach, the numbers are used to examine past performance and make judgments of the future. They argue that this is ineffective in that, the variation concept does not apply. No method is used to separate common from special cause variation. Thus, it treats all variation as being the result of special causes. Also, there are several numbers involved, they are consolidated with no consistent basis, and in complex businesses, these numbers have become difficult to manage. Budgets are reworked frequently causing a significant waste of management's time each year. In addition, it focuses on numerical goals rather than on the system, which is "the key role of management," according to Francis and Gerwels. Plus, it encourages short-term thinking. They argue that there is no constancy of purpose (Deming's term) in improving business performance when this system is used.
On the other hand, the new method takes advantage of the theory of variation, which separates common and special causes, and focuses on management making desirable system changes. As mentioned, when special causes are present, local management action might be required. If the effect is undesirable and continuous (i.e., not a one time event), the cause must be found and removed. Also, unlike the classical approach, the numbers are fewer and are based on statistical methods. Francis and Gerwels said, "The major benefit [of this new method] will come from the use of scarce resources for value-added work and from the improvement in management effectiveness from understanding what the role of management is. A manager’s job is primarily to improve systems. It is not to manage by numbers or inspect the work of others" (75).
____________________________________________________
Related summaries:
Albright, T. L. and H. Roth. 1993. Controlling quality on a multidimensional level. Journal of Cost Management (Spring): 29-37. (Summary).
Deming, W. E. 1993. The New Economics for Industry For Industry, Government & Education. Cambridge: Massachusetts Institute of Technology Center for Advanced Engineering Study. Chapter 10. (Summary).
Holmes, D. S. and R. E. Hurley. 2003. How SPC enhances budgeting and standard costing - Another look. Management Accounting Quarterly (Fall): 57-62. (Summary).
Martin, J. R. Not dated. Chapter 1: Introduction to Managerial Accounting, Cost Accounting and Cost Management Systems. Management Accounting: Concepts, Techniques & Controversial Issues. Management And Accounting Web. Chapter1.htm
Martin, J. R. Not dated. Chapter 3: Cost Behavior Analysis & Statistical Process Control - Part II. Management Accounting: Concepts, Techniques & Controversial Issues. Management And Accounting Web. Chapter3PartII.htm
Martin, J. R. Not dated. Chapter 9: The Master Budget or Financial Plan. Management Accounting: Concepts, Techniques & Controversial Issues. Management And Accounting Web. Chapter9.htm
Nolan, T. W. and L.P. Provost. 1990. Understanding Variation. Quality Progress (May): 70-78. (Summary).
Reeve, J. M. 1989. The impact of variation on operating system performance. Proceedings of the Third Annual Management Accounting Symposium. Sarasota: American Accounting Association: 75-89. (Summary).
Reeve, J. M., and J. W. Philpot. 1988. Applications of statistical process control for financial management. Journal of Cost Management (Fall): 33-40. (Summary).
Roehm, H. A., L. Weinstein, and J. F. Castellano. 2000. Management control systems: How SPC enhances budgeting and standard costing. Management Accounting Quarterly (Fall): 34-40. (Summary).
Walter, R., M. Higgins and H. Roth. 1990. Applications of control charts. The CPA Journal (April): 90-93, 95. (Summary).