Summary by Manuel Pagan
Master of Accountancy Program
University of South Florida, Summer 2002
Budgeting Main Page | SPC Main Page
Organizations establish control systems to help mitigate risks to the achievement of organizational objectives. These control systems are comprised of: A set of measures for defined entities, criteria for evaluating these measures, and processes for obtaining these measures and evaluating them. The output of a company’s accounting system becomes the ‘set of measures,’ and the predetermined standards and budgets represent the ‘criteria for evaluating these measures.’ Companies establish standards as a mechanism to determine whether control systems are operating properly. These standards are then typically compared to the output of a company’s accounting system. Various analyses between the standard and actual results are then performed to help determine the effectiveness of the control system. However, problems arise when comparing a standard to actual results because typical accounting systems do not consider the natural variability in a controlled and stable system. The purpose of this article is to show the effect of statistical process control (SPC) when evaluating a standard against an actual result. SPC is a statistical tool used to determine whether a process is in statistical control.
Standard Cost Example
A fictitious company produces widgets seven days a week. The production process was built with the expectation of producing 60 widgets an hour, using 40 workers, working two 7½-hour shifts per day at a labor rate of $12 per hour. However, during a one-month span the production process averaged approximately 55 widgets per hour (remember, the standard is 60 widgets per hour). Disregarding the math, the labor efficiency variance for the first week, first shift was $360 unfavorable. Likewise, most accounting variances will be unfavorable. Now compare this to SPC.
Statistical Process Control
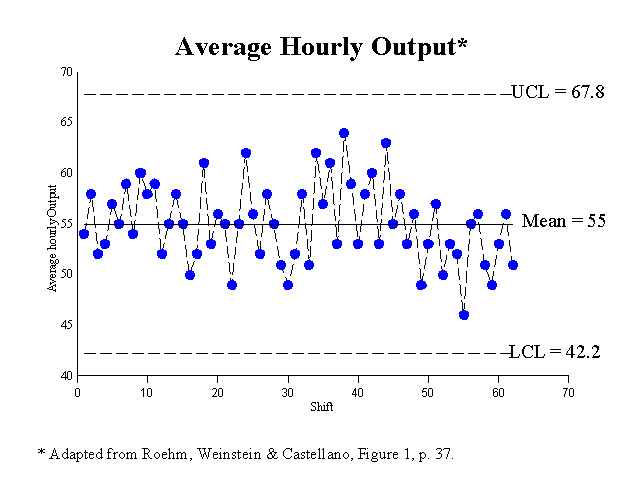
The average hourly production per shift for the same one-month period is plotted on a graph (See below). These 62 data points show the one-month average is 55 widgets per hour. Using SPC we now calculate an upper and lower control limit (mean plus three standard deviations). The upper control limit is 67.8 and lower control limit is 42.2 widgets per hour. Before we conclude that the process is operating within it’s natural variation, we must calculate a moving average and control limits for these moving averages.
| Adapted from Table 1: Production for 31 Days | ||||||||||
| Week 1 | Week 2 | Week 3 | Week 4 | Week 5 | ||||||
| Day | Shift 1 | Shift 2 | Shift 1 | Shift 2 | Shift 1 | Shift 2 | Shift 1 | Shift 2 | Shift 1 | Shift 2 |
| Monday | 54 | 58 | 55 | 50 | 51 | 49 | 53 | 63 | 56 | 51 |
| Tuesday | 52 | 53 | 52 | 61 | 52 | 58 | 55 | 58 | 49 | 53 |
| Wednesday | 57 | 55 | 53 | 56 | 51 | 62 | 53 | 56 | 56 | 51 |
| Thursday | 59 | 54 | 55 | 49 | 57 | 61 | 49 | 53 | ||
| Friday | 60 | 58 | 55 | 62 | 53 | 64 | 57 | 50 | ||
| Saturday | 59 | 52 | 56 | 52 | 59 | 53 | 53 | 52 | ||
| Sunday | 55 | 58 | 58 | 55 | 58 | 60 | 46 | 55 | ||
| Weekly Hourly Average | 56.57 | 55.43 | 54.86 | 55.00 | 54.43 | 58.14 | 52.29 | 55.29 | 53.67 | 51.67 |

When all is said and done, all points for both the first and second sets of data fall within their respective upper and lower control limits. With no indications of nonrandom patterns, the process can now be declared in statistical control. In layman’s terms, the process of manufacturing widgets will produce an average of 55 units per hour, however, for any specific hour, production could range between 67.8 and 42.2 widgets. What this tells us is that the present system is not capable of averaging the expected standard of 60 widgets per hour. If we assume the standard is now 55 widgets per hour, the labor efficiency variance for the first week, first shift is $72 unfavorable; far less than the $360 previously calculated assuming a standard of 60 widgets per hour. Furthermore, over the life of the process the labor efficiency variances should net to zero.
Two other important points made in this article include the following:
1. Employees are only part of the
system that includes many other components (e.g., product designs, production designs, quality
of material, quality of equipment, corporate culture, training and placement of people). As
a result it is impossible to separate the effects of the people working in the system from the
effects of other components of the system.
2. Effective control systems must be able to separate the
common cause (system) variation from special cause variation.
Otherwise, every variation will appear to be a special cause variation. Management will not be
able to separate the noise (common cause or random variation) from the real signals
(special cause variation).
Conclusion
Accountants are often asked to establish acceptable variance limits for measuring performance of control systems, however, these standards rarely take into consideration the natural variability of a controlled and stable system. In the example above, the company arbitrarily set a standard of 60 widgets per hour. Yet the system and its components are not capable of producing 60 widgets per hour. At best it will produce a maximum of 67.7, a minimum of 42.2, and a long-term average of 55 widgets per hour. The only way management can increase the production average is by changing the system components.
This concept is important because as a process is designed and developed, the actual capability of the process needs to be determined and compared to the original standard. Then either the standard or the system will have to be adjusted to meet management’s expectations. People operating a system can be given targets, but these goals must be determined within the context of a system’s capabilities. These capabilities are determined using SPC.
____________________________________________
Questions to consider
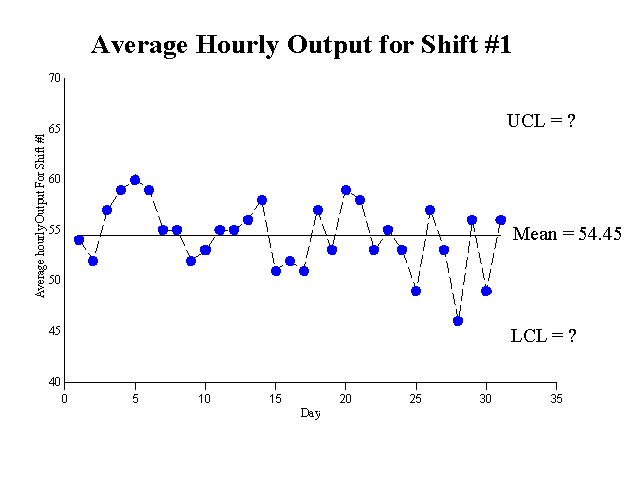
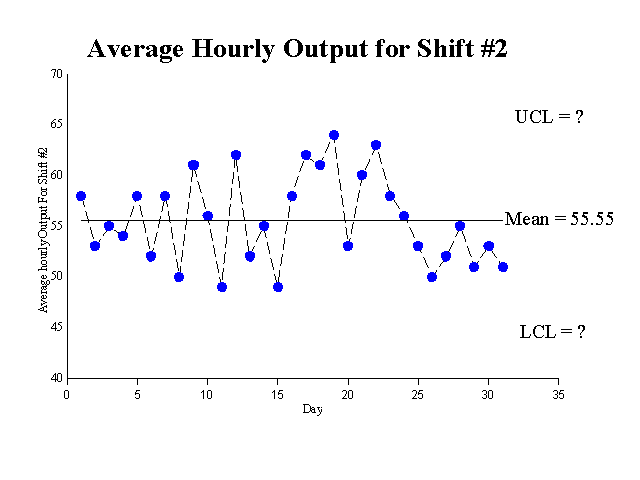
1. Should the data from the two shifts be combined? See the graphs below for the separate shifts and Holmes & Hurley who disagree with the analysis in this paper.
2. Why can't we calculate the upper and lower limits for each shift from the data above?
3. Do the two shifts represent one system or two systems? Why might the two shifts represent two systems?


Related summaries:
Albright, T. L. and H. Roth. 1993. Controlling quality on a multidimensional level. Journal of Cost Management (Spring): 29-37. (Summary).
Deming, W. E. 1993. The New Economics for Industry For Industry, Government & Education. Cambridge: Massachusetts Institute of Technology Center for Advanced Engineering Study. Chapter 10. (Summary).
Francis, A. E. and J. M. Gerwels. 1989. Building a better budget. Quality Progress (October): 70-75. (Summary).
Holmes, D. S. and R. E. Hurley. 2003. How SPC enhances budgeting and standard costing - Another look. Management Accounting Quarterly (Fall): 57-62. (Summary).
Lucier, G. T. and S. Seshadri. 2001. GE takes six sigma beyond the bottom line. Strategic Finance (May): 40-46. (Summary).
Martin, J. R. Not dated. Chapter 3: Cost Behavior Analysis & Statistical Process Control - Part II. Management Accounting: Concepts, Techniques & Controversial Issues. Management And Accounting Web. Chapter 3 Part II
Martin, J. R. Not dated. Chapter 9: The Master Budget or Financial Plan. Management Accounting: Concepts, Techniques & Controversial Issues. Management And Accounting Web. Chapter9
Martin, J. R. Not dated. Chapter 10: Standard Full Absorption Costing. Management Accounting: Concepts, Techniques & Controversial Issues. Management And Accounting Web. Chapter 10
Martin, J. R. Not dated. What is Six Sigma? Management And Accounting Web. Six Sigma Summary
Nolan, T. W. and L. P. Provost. 1990. Understanding Variation. Quality Progress (May): 70-78. (Summary).
Reeve, J. M. 1989. The impact of variation on operating system performance. Proceedings of the Third Annual Management Accounting Symposium. Sarasota: American Accounting Association: 75-89. (Summary).
Reeve, J. M., and J. W. Philpot. 1988. Applications of statistical process control for financial management. Journal of Cost Management (Fall): 33-40. (Summary).
Walter, R., M. Higgins and H. Roth. 1990. Applications of control charts. The CPA Journal (April): 90-93, 95. (Summary).