Summary by James R. Martin, Ph.D., CMA
Professor Emeritus, University of South Florida
ABC Main Page | Time-driven ABC Bibliography
| Health Care Cost Main Page
Health care costs in the U.S. are rapidly escalating and currently exceed 17% of GDP. Although there are many reasons for this trend (aging population, development of new treatments, perverse incentives caused by reimbursements for procedures rather than outcomes), a more fundamental problem is related to the ineffective cost systems used in health care. Providers do not understand their costs and attempt to control cost with across-the-board cuts that frequently lead to higher total costs and less desirable outcomes for patients. Inadequate cost systems also lead to cross-subsidies and the inability to distinguish between effective and ineffective providers. This destroys the incentives needed to develop more effective reimbursement approaches. The purpose of this paper is to present a solution to these problems where patients and their conditions become the unit of analysis rather than departments, procedures, or services. The authors refer to the solution as time-driven activity-based costing.
Understanding the Value of Health Care
Properly understanding and managing the value of health care requires measuring outcomes and costs across the health care cycle including diagnosis, treatment and ongoing management. A particular patient population is the proper unit of value measurement. The health value equation includes health outcomes and the total costs required to deliver those outcomes during a patient's full cycle of care for a specific medical condition. The key to driving down costs in health care is combining an accurate cost system with the systematic measurement of outcomes.
The Challenges of Health Care Costing
Accurate health care costing is challenging because of the fragmented way health care is provided, the different paths patients take through the system, and the different procedures, drugs, devices, tests and equipment physicians use for the same medical condition. Current health care cost systems tend to focus on individual organization units and do little to reduce costs and improve value.1 However, time-driven ABC, together with a good estimate of a patient's path through the system for a particular medical condition can provide much more accurate costing. Estimates of two parameters are needed at each step in the process: the cost of each resource used in the process, and the quantity of time the patient spends with each resource.
A Simple Example
The example includes a patient (Jones), an administrator (Allen), a nurse (White), and a physician (Green). Patient Jones spends 18 minutes with administrator Allen, 24 minutes with nurse White, and 9 minutes with Physician Green. The time-driven ABC approach requires the following:
1. Determine the total resource cost for each resource including benefits, supervision, occupancy, technology and support.
2. Determine the capacity of each resource supplied. In this example, capacity refers to time available for patient care, excluding the time the employee is not available for work, e.g., vacation, holidays, sick days, meetings, training, etc.
3. Calculate the capacity cost rate for each resource:
Capacity cost rate = Costs attributable to the resource ÷ Available capacity of the resource
Based on these calculations, the capacity cost rates for the three resources are: $45 per hour for Administrator Allen, $65 per hour for Nurse White, and $300 per hour for Physician Green. Using these rates, the cost of Patient Jones visit is (.3 hours)($45) + (.4 hours)($65) + (.15 hours)($300) = $84.50. For another simple example of time-driven ABC with more detail see the summaries listed below.
The Cost Measure Process
The health care cost measurement process includes the following steps.
1. Select the medical condition and define the beginning and end of the patient care cycle.
2. Define the care delivery value chain that charts the main activities involved in the patient's care for the medical condition. This is the starting point for mapping the processes. The following graphic is an adaptation of a much more involved illustration that appears on page 56 of the article.
3. Develop detailed process maps of each activity in the patient care delivery value chain. The graphic below was adapted from an illustration on page 59 showing the steps a patient takes through a hospital visit for knee surgery, i.e., laryngoscopy.
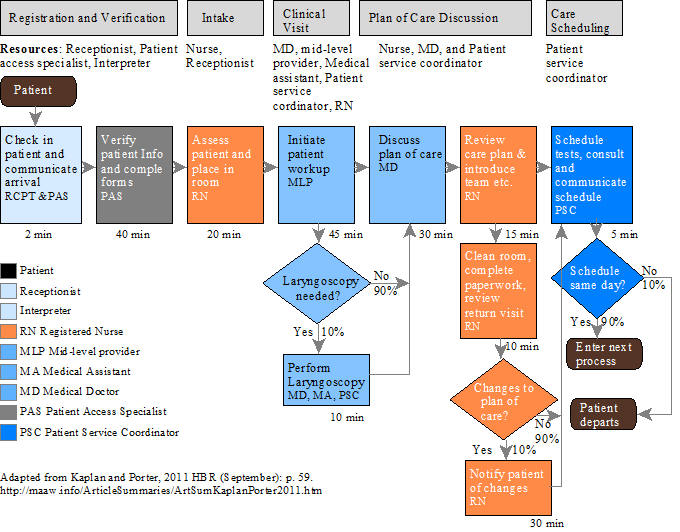
4. Obtain time estimates for each process. Standard times are recommended for short duration inexpensive processes. Actual duration times are needed for more time-consuming processes such as surgery. Note that the time requirements are indicated below each activity in the illustration above.
5. Estimate the cost of supplying patient care resources excluding time spent on non-clinical activities, e.g., physicians time at university medical centers spent on teaching and research. This cost estimate also includes the costs of departments and activities that support the patient-facing work. Using the rule-of-one, support departments that include more than one person or resource represent variable costs.2
6. Estimate the practical capacity of each resource:
Monthly practical capacity = (Total number of days actually worked each year ÷ 12)(Total number of hours per day the employee is available for work - The average number of hours per workday used for non-patient related work).
7. Calculate the capacity cost rate:
The Capacity Cost Rate = Costs attributable to the resource ÷ Available capacity of the resource
8. Calculate the total cost of patient care for each resource and sum up all the cost across all the processes used.
Cost of patient care for each resource = (Capacity cost rates for each resource)(Amount of time the patient spent with the resource)
Opportunities to Improve Value, Eliminate Variations, and Improve Capacity Utilization
Creating process maps and accurately estimating the resource costs involved over the patient care cycle provides powerful new ways to improve and restructure health care delivery previously hidden in siloed cost systems. Process variation is revealed and reduced, and process steps are eliminated that do not improve outcomes. Comparing process maps across facilities can also reveal potential improvements. Since the time-driven ABC capacity cost rates are based on the practical capacity of resources, it provides measures of both used and unused capacity. Most of the excess capacity is caused by redundancy throughout the health care system (the just-in-case approach). Accurate costing provides the tool for solving this problem by showing where consolidating patient care can be beneficial.
Deliver the Right Processes at the Right Locations, Match Clinical Skills to the Process, Speed up Cycle Time, and Optimize the Full Cycle of Care
More accurate cost systems reveal opportunities to reduce over-resourced facilities and provide particular services at properly resourced lower-cost locations. They also reveal opportunities to use skilled but lower-cost health care professionals to perform some processes currently performed by physicians, thus speeding up cycle time. Time-driven ABC also makes redundancy visible which helps motivate professionals to work together to integrate care across specialties.
Capturing the Payoffs
Time-driven ABC provides a powerful tool for modeling the effect of an improvement on costs, and helps avoid across-the-board cuts which is a typical response to lower reimbursements from government programs such as Medicare and Medicaid.
Reinventing Reimbursement
The current system of reimbursements discourages providers and payers from pursuing more cost-effective processes because it is not based on actual costs and outcomes. The current inadequate costing approach causes massive cross subsidies that over compensate some services and under compensate others. The fee for service payment system must be replaced with a value-based reimbursement system such as bundled payments that covers the full cycle of care. This would reward providers that provide the best overall care at the lowest costs. More accurate cost systems with better outcome measurements will help promote reimbursement methods that encourage innovation. Accurately measuring costs and health care outcomes is the most powerful lever available for unlocking a whole cascade of opportunities for process improvement, better organization and reimbursement methods for improving value creation in health care.
____________________________________________
Footnotes:
1 The paper includes sidebars describing three myths related to the current health care cost system:
Myth # 1: Charges are a good surrogate for provider costs. The problem is the view that charges billed or reimbursements paid reflect the costs of resources used. The current reimbursement system introduces major incentive problems because it is based on average estimates (RVUs or relative value units derived from surveys of physicians), and ignores the quality of the service provided.
Myth # 2: Hospital overhead costs are too complex to allocate accurately. In current health care cost systems indirect (support) costs are spread over each department's activities using a peanut-butter approach based on an allocation basis such as the size of direct costs, head count, space, number of patients or some other arbitrary measurement. This distorts the profitability of departments and activities and leads to various types of dysfunctional decisions.
Myth # 3: Most health care cost are fixed. Kaplan and Porter estimate that only about 5% of health care costs are fixed. Remember the rule of one.
2 See Myth # 3 above.
Related Time-driven ABC summaries:
Kaplan, R. S. and S. R. Anderson. 2007. The innovation of time-driven activity-based costing. Cost Management (March/April): 5-15. (Summary).
Kaplan, R. S. and S. R. Anderson. 2004. Time-driven activity-based costing. Harvard Business Review (November): 131-138. (Summary).
Kaplan, R. S., M. E. Porter and M. L. Frigo. 2017. Managing healthcare costs and value. Strategic Finance (January): 24-33. (Summary).
Porter, M. E. and T. H. Lee. 2013. The strategy that will fix health care: Providers must lead the way in making value the overarching goal. Harvard Business Review (October): 50-67. (This article shows how the time-driven ABC approach fits into the strategic value agenda for a high-value health care delivery system). (Summary).
Other Related summaries:
Anderson, S. W., J. W. Hesford and S. M. Young. 2002. Factors influencing the performance of activity based costing teams: A field study of ABC model development time in the automobile industry. Accounting, Organizations and Society 27(3): 195-211. (Summary).
Bast, J. L., R. C. Rue and S. A. Wesbury Jr. 1993. Why we spend too much on Health Care and what we can do about it. Heartland Institute. (Summary).
Brausch, J. M. and T. C. Taylor. 1997. Who is accounting for the cost of capacity? Management Accounting (February): 44-46, 48-50. (Summary).
Church, A. H. 1995. Overhead: The cost of production preparedness. Journal of Cost Management (Summer): 66-71. (Reprint of Church, A. H. 1931. Overhead: The cost of production preparedness. Factory and Industrial Management (January): 38-41. (Summary).
Cooper, R. 1990. Implementing an activity-based cost system. Journal of Cost Management (Spring): 33-42. (Summary).
Cooper, R. and R. S. Kaplan. 1992. Activity-based systems: Measuring the costs of resource usage. Accounting Horizons (September): 1-13. (Summary).
Cooper, R., and R. S. Kaplan. 1998. The promise - and peril - of integrated cost systems. Harvard Business Review (July-August): 109-119. (Summary 1, (Summary 2).
Debruine, M. and P. R. Sopariwala. 1994. The use of practical capacity for better management decisions. Journal of Cost Management (Spring): 25-31. (Summary).
Gantt, H. L. 1994. The relation between production and costs. Journal of Cost Management (Spring): 4-11. This is a presentation Gantt made in 1915. (Summary).
Kaplan, R. S. 1990. The four stage model of cost systems design. Management Accounting (February): 22-26. (Summary).
Krumwiede, K. R. 1998. ABC: Why it's tried and how it succeeds. Management Accounting (April): 32-34, 36, 38. (Summary).
Mangan, T. N. 1995. Integrating an activity-based cost system. Journal of Cost Management (Winter): 5-13. (Summary).
Martin, J. R. 2000. The advantages of teaching three production volume variances. Journal of Accounting Education 18(1): 35-50. (ABC variance analysis based on an example from Kaplan, R. S. and R. Cooper. 1998. Cost and Effect: Using Integrated Cost Systems to Drive Profitability and Performance. Boston: Harvard Business School Press).
Martin, J. R. Not dated. Chapter 7: Activity Based Product Costing. Management Accounting: Concepts, Techniques & Controversial Issues. Management And Accounting Web. Chapter7.htm
McNair, C. J. 1994. The hidden costs of capacity. Journal of Cost Management (Spring): 12-24. (Summary).
Mecimore, C. D. and A. T. Bell. 1995. Are we ready for fourth-generation ABC? Management Accounting (January): 22-26. (Summary).
