Summary by Erica M. Hutchison
Master of Accountancy Program
University of South Florida, Summer 2001
CM & Direct Costing Main Page | CVP Main Page |
TOC Main Page
The purpose of this article is, first, to argue that cost-volume-profit analysis is still relevant to modern manufacturing firms; and, second, to argue that efficiently utilizing the infrastructure of a firm to increase production volume can be profitable.
The basic cost-volume-profit analysis (CVP) assumes constant levels of fixed costs, unit variable costs and selling prices. The graph indicates a "break-even" level of activity where the sales curve intersects with the cost curve. The purpose of CVP is to show the sensitivity of profits to changes in volume.

CVP analysis emphasizes maximizing contribution and focuses on the difference between costs that vary with output and costs that remain constant.
When CVP was developed, manufacturing firms had different cost structures than modern manufacturing firms. Modern firms have a higher level of costs that remain constant with changes in output, partly because modern firms are more capital intensive, and partly because most of their labor cost is fixed. For example, the supervisor of a machine is paid the same salary if the machine is running at 50% or 75%. Many authors argue that traditional views of maximizing contribution are no longer relevant.
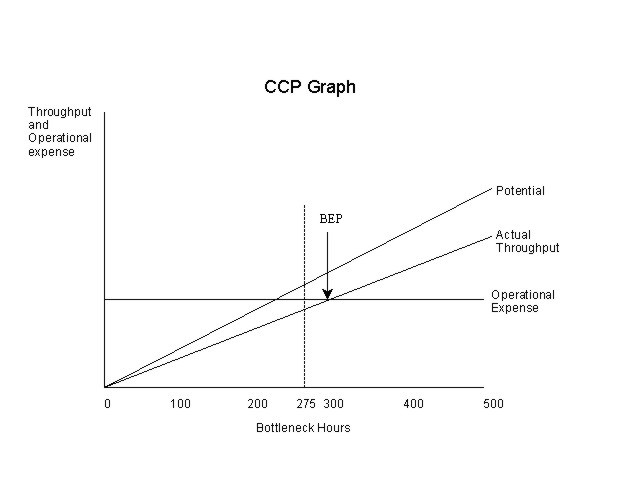
In this article, Luther and O’Donovan argue that contribution maximization is still relevant. They modified the traditional CVP analysis and applied Goldratt’s Theory of Constraints. In their new approach to CVP, Luther and O’Donovan replace production volume with a constraint on the horizontal axis and termed the new approach cost-constraint-profit analysis (CCP).

In Goldratt’s Theory of Constraints, performance is measured by throughput, inventory and operational expense. A constraint in a manufacturing system is anything that limits manufacturing volume. The capacity to generate throughput is frequently constrained by bottlenecks. The goal of the manufacturing system is to maximize throughput per bottleneck hour.
Suppose that the bottleneck hours in a period were constrained to 275 hours. While the system had the potential to break-even, the actual throughput curve shows that the system failed to break-even at 275 hours. The arrow on the graph at the intersection of throughput and operating expense shows that 300 bottleneck hours are needed to break-even. In order to break-even, throughput per operating hour needs to be increased. This increase can be achieved by:
1. Altering the product mix
2. Changing work practices or
3. Increasing the selling price
The reason behind the failure to achieve potential throughput needs to be investigated by management. This failure could have been caused by:
1. Down time
2. Non-availability of raw materials
3. Poor quality inputs or
4. Excessive set-up times
In addition, operating leverage can be used to increase throughput by reducing variable costs and increasing both the flexibility of the manufacturing process and relaxing the constraint. An increase in operating expense provides an increase in throughput. However, operational expense should not be increased unless the cost can be recovered through the increase in throughput.
Cost control is important in a manufacturing firm that is using CCP. It is important to realize that reducing the cost for an individual unit is not profitable unless the cost of the entire product line is reduced. The excess capacity that exists at the non-bottleneck areas of the plant needs to be controlled. Activity based costing can be helpful in controlling cost in the long-term, as long as ABC does not decrease the importance of volume as a "profit-driver".
____________________________________________
Related summaries:
Atwater, B. and M. L. Gagne. 1997. The theory of constraints versus contribution margin analysis for product mix decisions. Journal of Cost Management (January/February): 6-15. (Summary).
Goldratt, E. M. 1990. What is this thing called Theory of Constraints. New York: North River Press. (Summary).
Goldratt, E. M. 1990. The Haystack Syndrome: Sifting Information Out of the Data Ocean. New York: North River Press. (Summary).
Goldratt, E. M. 1992. From Cost world to throughput world. Advances In Management Accounting (1): 35-53. (Summary).
Goldratt, E. M. and J. Cox. 1986. The Goal: A Process of Ongoing Improvement. New York: North River Press. (Summary).
Hall, R., N. P. Galambos, and M. Karlsson. 1997. Constraint-based profitability analysis: Stepping beyond the Theory of Constraints. Journal of Cost Management (July/August): 6-10. (Summary).
Kee, R. C. 2001. Implementing cost-volume-profit analysis using an activity-based costing system. Advances in Management Accounting (10): 77-94. (Summary).
Martin, J. R. Not dated. Comparing Dupont's ROI with Goldratt's ROI. Management And Accounting Web. ComparingDupontGoldrattROI.htm
Martin, J. R. Not dated. Drum-Buffer-Rope System. Management And Accounting Web. DrumBufferRope.htm
Martin, J. R. Not dated. Global measurements of the theory of constraints. Management And Accounting Web. TOCMeasurements.htm
Martin, J. R. Not dated. Goldratt's dice game or match bowl experiment. Management And Accounting Web. MatchBowlExperiment.htm
Martin, J. R. Not dated. TOC problems and introduction to linear programming. Management And Accounting Web. TOCProblemsIntroToLP.htm
Rezaee, Z. and R. C. Elmore. 1997. Synchronous manufacturing: Putting the goal to work. Journal of Cost Management (March/April): 6-15. (Summary).
Ruhl, J. M. 1996. An introduction to the theory of constraints. Journal of Cost Management (Summer): 43-48. (Summary).
Ruhl, J. M. 1997. The Theory of Constraints within a cost management framework. Journal of Cost Management (November/December): 16-24. (TOC Illustration).
Westra, D., M. L. Srikanth and M. Kane. 1996. Measuring operational performance in a throughput world. Management Accounting (April): 41-47. (Summary).
Yahya-Zadeh, M. 1999. Integrating long-run strategic decisions into the theory of constraints. Journal of Cost Management (January/February): 11-19. (Summary).