Summary by James R. Martin, Ph.D., CMA
Professor Emeritus, University of South Florida
Deming Main Page | Quality Related Main Page
The purpose of this paper is to examine whether measurement choices "can strengthen the forward looking properties of a quality measure" (e.g., strengthen the relationship between the measure and financial performance) and its usefulness for decision making and control. More specifically, the author examines the standards used to measure quality (e.g., expected outcome versus optimum outcome), the symmetry of the relationship between a quality measure and future quality costs (i.e., is the loss function symmetrical on both sides of the optimum outcome?), and the functional form of the relationship between the quality measure and the future quality costs, (i.e., the traditional tolerance limit (dichotomous) model, Taguchi's quadratic model, or alternative linear model).
Theory Development
According to "gap analysis" (from marketing theory), a customer's overall satisfaction with a product or service is a function of the difference between the customer's expected outcome and the actual outcome. In other words, this perceived quality measure has forward-looking properties that might dominate an absolute quality measure. This is the basis of Hypothesis 1.
H1: "An expectation-adjusted quality measure (i.e., quality measured against the ex ante expected outcome) is more strongly associated with future quality costs (e.g., warranty costs) than an absolute quality measure (i.e., quality measured against the optimal outcome)." (p. 557).
The service customer's expected net benefit of warranty work (rework) is a determinant of whether the customer seeks resolution of poor initial service. This assumption is the basis for Hypothesis 2.
H2: "The magnitude of the (negative) relation between quality and future warranty costs is increasing in the expected net benefits to the customer of the warranty work". (p.558).
Functional Forms
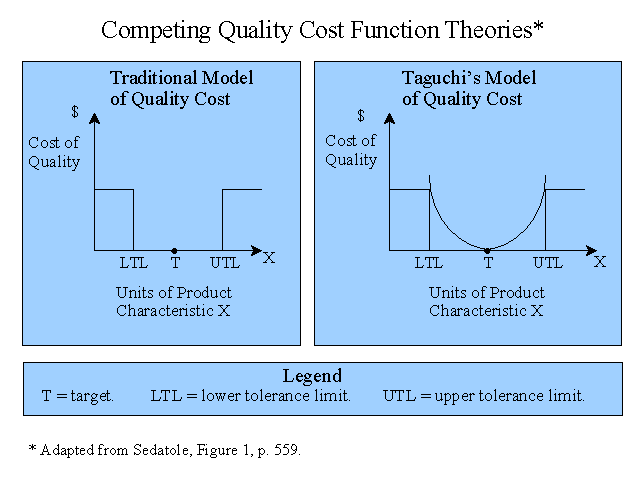
There are various functional forms, or models of quality costs. The traditional dichotomous tolerance limit model and Taguchi's quadratic model are illustrated in the graphic below. In the traditional model, a range of acceptable outcomes is established between the upper and lower tolerance limits, i.e., no loss is assumed within this range. In Taguchi's model any deviation from the target outcome will generate a cost as measured by a U-shaped function. These two models and a linear model are considered in this study. (The traditional approach has been referred to as the Goalpost model, Juran's model and the Zero Defects model. Taguchi's approach is sometimes referred to as the Robust Quality model. See the article summaries below for more information).

The Research Site and Service
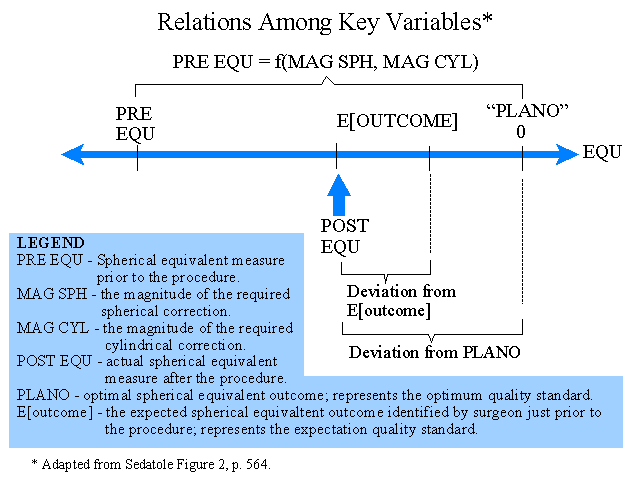
The field study was done at five facilities of a medical firm that performs laser vision correction surgery. The author describes the procedure that usually involves two corrections (i.e., spherical and cylindrical) combined into one measure called the "spherical equivalent" or EQU. The measure referred to as PLANO represents perfect eyesight or 20/20 vision. PRE EQU refers to the patients eyesight prior to the procedure. E[outcome] is the expected outcome or eyesight prior to the procedure.
Quality and Quality Cost Function Measurement
The cost of performing enhancements (rework) is a significant quality-related cost. This warranty cost is captured with a dichotomous variable represented by the incidence of an enhancement. The warranty cost proxy used in the study is the duration of the initial procedure, calculated as the number of days from the initial procedure to the enhancement. The test for H1 is based on the associations between the warranty cost proxy DURATION and the deviations between the POST EQU and PLANO, and the POST EQU and E[outcome]. An adaptation of the author's graphic illustration of the quality measurements is provided below.

The results, presented in Table 3 (not included here) do not support H1 or prior theory. Instead, the results indicate that the absolute standard, rather than the expected standard, is more highly correlated with future warranty costs.
Asymmetry in the Quality Cost Function
Overcorrections involve more difficult rework than undercorrections. The results related to overcorrections are consistent with H2 indicating that a decrease in the expected net benefits to the customer of warranty work (rework) decreases the negative relation between quality and future warranty costs. However, although overcorrections are not associated with increased warranty costs, they may create other costs such as damaging the firm's reputation.
Functional Forms of the Quality Cost Function
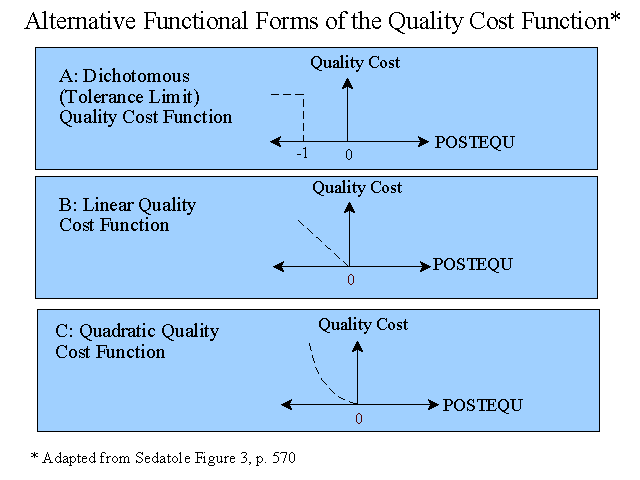
The test of functional forms is restricted to undercorrections. Three measures of quality are used based on the deviation of POST EQU from PLANO.
1. OUTTOL = 1 if Abs(POST EQU) > 1, and 0 if otherwise. (Model A below).
2. DEVIATION = Abs(POST EQU). (Model B below).
3. DEVAITION2 = [Abs(POST EQU)]2. (Model C below).
4. All three measures.

The results of the tests of the models are provided in Table 5 (not included here) and show that using the optimal outcome PLANO as the standard, neither the dichotomous model or the quadratic model add explanatory power over the linear model to predict quality costs.
Quality Management Illustration
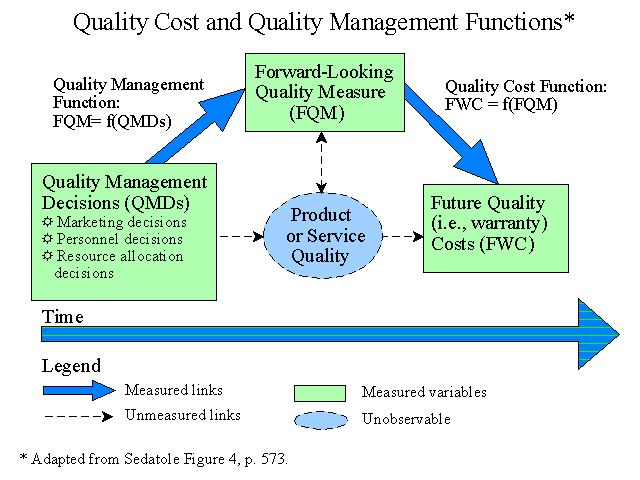
This section involves an illustration related to marketing decisions, personnel decisions, and resource allocation decisions using the three models (rearranged):
1. DEVIATION = Abs(POST EQU).
2. DEVAITION2 = [Abs(POST EQU)]2.
3. OUTTOL = 1 if Abs(POST EQU) > 1, and 0 if otherwise.
The relationships tested in this section are illustrated in the following graphic.

The results show significant relationships between management choices and the forward-looking quality measure DEVIATION (Model 1). Decisions differ and in some cases would be incorrect when the other forms of the model (2 and 3) are used.
____________________________________________
Related summaries:
Albright, T. L. and H. Roth. 1992. The measurement of quality costs: An alternative paradigm. Accounting Horizons (June): 15-27. (Summary).
Albright, T. L. and H. Roth. 1993. Controlling quality on a multidimensional level. Journal of Cost Management (Spring): 29-37. (Summary).
Albright, T. L. and H. P. Roth. 1994. Managing quality through the quality loss function. Journal of Cost Management (Winter): 20-37. (Summary).
Anderson, S. W. and K. Sedatole. 1998. Designing quality into products: The use of accounting data in new product development. Accounting Horizons (September): 213-233. (Summary).
Carr, L. P. and L. A. Ponemon. 1994. The behavior of quality costs: Clarifying the confusion. Journal of Cost Management (Summer): 26-34. (Summary).
Deming, W. E. 1993. The New Economics for Industry For Industry, Government & Education. Cambridge: Massachusetts Institute of Technology Center for Advanced Engineering Study. Chapter 10. (Summary).
Fargher, N. and D. Morse 1998. Quality costs: Planning the trade-off between prevention and appraisal activities. Journal of Cost Management (January/February): 14-22. (Summary).
Kim, M. W. and W. M. Liao. 1994. Estimating hidden quality costs with quality loss functions. Accounting Horizons (March): 8-18. (Summary).
Martin, J. R. Not dated. Summary of the 1992 PBS Program Quality or Else. Management And Accounting Web. QualityOrElse.htm
Pasewark, W. R. 1991. The Evolution of quality control costs in U.S. manufacturing. Journal of Cost Management (Spring): 46-52. (Summary).
Roehm, H. A., D. Klein and J. F. Castellano. 1995. Blending quality theories for continuous improvement. Management Accounting (February): 26-32. (Summary).
Rust, K. G. 1995. Measuring the costs of quality. Management Accounting (August): 33-37. (Summary).
Shank, J. K. and Vijay Govindarajan. 1994. Measuring the "Cost of Quality": A strategic cost management perspective. Journal of Cost Management (Summer): 5-17. (Summary).
Sjoblom, L. M. 1998. Financial information and quality management - Is there a role for accountants? Accounting Horizons (December): 363-373. (Summary).
Taguchi, G. and D. Clausing. 1990. Robust quality. Harvard Business Review (January-February): 67-75. (Summary).